1 Scope of the Report
1.1 Market Introduction
1.2 Years Considered
1.3 Research Objectives
1.4 Market Research Methodology
1.5 Research Process and Data Source
1.6 Economic Indicators
1.7 Currency Considered
2 Executive Summary
2.1 World Market Overview
2.1.1 Global UV Absorber Consumption 2016-2026
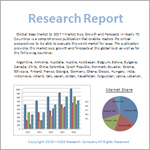
2.1.2 UV Absorber Consumption CAGR by Region
2.2 UV Absorber Segment by Type
2.2.1 Salicylate Type
2.2.2 Benzotriazole Type
2.2.3 Benzophenone Type
2.2.4 Triazine Type
2.2.5 Other
2.3 UV Absorber Sales by Type
2.3.1 Global UV Absorber Sales Market Share by Type (2016-2021)
2.3.2 Global UV Absorber Revenue and Market Share by Type (2016-2021)
2.3.3 Global UV Absorber Sale Price by Type (2016-2021)
2.4 UV Absorber Segment by Application
2.4.1 Plastic Products
2.4.2 Polyester
2.4.3 Chlorine Polyester
2.4.4 Polyvinyl Chloride
2.4.5 Other
2.5 UV Absorber Sales by Application
2.5.1 Global UV Absorber Sale Market Share by Application (2016-2021)
2.5.2 Global UV Absorber Revenue and Market Share by Application (2016-2021)
2.5.3 Global UV Absorber Sale Price by Application (2016-2021)
3 Global UV Absorber by Company
3.1 Global UV Absorber Sales Market Share by Company
3.1.1 Global UV Absorber Sales by Company (2019-2021)
3.1.2 Global UV Absorber Sales Market Share by Company (2019-2021)
3.2 Global UV Absorber Revenue Market Share by Company
3.2.1 Global UV Absorber Revenue by Company (2019-2021)
3.2.2 Global UV Absorber Revenue Market Share by Company (2019-2021)
3.3 Global UV Absorber Sale Price by Company
3.4 Global Manufacturers UV Absorber Producing Area Distribution, Sales Area, Product Type
3.4.1 Key Manufacturers UV Absorber Product Location Distribution
3.4.2 Players UV Absorber Products Offered
3.5 Market Concentration Rate Analysis
3.5.1 Competition Landscape Analysis
3.5.2 Concentration Ratio (CR3, CR5 and CR10) & (2019-2021)
3.6 New Products and Potential Entrants
3.7 Mergers & Acquisitions, Expansion
4 UV Absorber by Region
4.1 Global UV Absorber by Region
4.1.1 Global UV Absorber Sales by Region
4.1.2 Global UV Absorber Revenue by Region
4.2 Americas UV Absorber Sales Growth
4.3 APAC UV Absorber Sales Growth
4.4 Europe UV Absorber Sales Growth
4.5 Middle East & Africa UV Absorber Sales Growth
5 Americas
5.1 Americas UV Absorber Sales by Country
5.1.1 Americas UV Absorber Sales by Country (2016-2021)
5.1.2 Americas UV Absorber Revenue by Country (2016-2021)
5.2 Americas UV Absorber Sales by Type
5.3 Americas UV Absorber Sales by Application
5.4 United States
5.5 Canada
5.6 Mexico
5.7 Brazil
6 APAC
6.1 APAC UV Absorber Sales by Region
6.1.1 APAC UV Absorber Sales by Region (2016-2021)
6.1.2 APAC UV Absorber Revenue by Region (2016-2021)
6.2 APAC UV Absorber Sales by Type
6.3 APAC UV Absorber Sales by Application
6.4 China
6.5 Japan
6.6 Korea
6.7 Southeast Asia
6.8 India
6.9 Australia
7 Europe
7.1 Europe UV Absorber by Country
7.1.1 Europe UV Absorber Sales by Country (2016-2021)
7.1.2 Europe UV Absorber Revenue by Country (2016-2021)
7.2 Europe UV Absorber Sales by Type
7.3 Europe UV Absorber Sales by Application
7.4 Germany
7.5 France
7.6 UK
7.7 Italy
7.8 Russia
8 Middle East & Africa
8.1 Middle East & Africa UV Absorber by Country
8.1.1 Middle East & Africa UV Absorber Sales by Country (2016-2021)
8.1.2 Middle East & Africa UV Absorber Revenue by Country (2016-2021)
8.2 Middle East & Africa UV Absorber Sales by Type
8.3 Middle East & Africa UV Absorber Sales by Application
8.4 Egypt
8.5 South Africa
8.6 Israel
8.7 Turkey
8.8 GCC Country
9 Market Drivers, Challenges and Trends
9.1 Market Drivers and Impact
9.1.1 Growing Demand from Key Regions
9.1.2 Growing Demand from Key Applications and Potential Industries
9.2 Market Challenges and Impact
9.3 Market Trends
10 Marketing, Distributors and Customer
10.1 Sales Channel
10.1.1 Direct Channels
10.1.2 Indirect Channels
10.2 UV Absorber Distributors
10.3 UV Absorber Customer
11 Global UV Absorber Market Forecast
11.1 Global UV Absorber Forecast by Region
11.1.1 Global UV Absorber Forecast by Regions (2021-2026)
11.2.2 Global UV Absorber Revenue Forecast by Regions (2021-2026)
11.2 Americas Forecast by Countries
11.3 APAC Forecast by Region
11.4 Europe Forecast by Countries
11.5 Middle East & Africa Forecast by Countries
11.6 Global UV Absorber Forecast by Type
11.7 Global UV Absorber Forecast by Application
12 Key Players Analysis
12.1 ADEKA
12.1.1 ADEKA ADEKA Company Information
12.1.2 ADEKA UV Absorber Product Offered
12.1.3 ADEKA UV Absorber Sales, Revenue, Price and Gross Margin (2019-2021)
12.1.4 ADEKA Main Business Overview
12.1.5 ADEKA Latest Developments
12.2 Mayzo
12.2.1 Mayzo Company Information
12.2.2 Mayzo UV Absorber Product Offered
12.2.3 Mayzo UV Absorber Sales, Revenue, Price and Gross Margin (2019-2021)
12.2.4 Mayzo Main Business Overview
12.2.5 Mayzo Latest Developments
12.3 SABO
12.3.1 SABO Company Information
12.3.2 SABO UV Absorber Product Offered
12.3.3 SABO UV Absorber Sales, Revenue, Price and Gross Margin (2019-2021)
12.3.4 SABO Main Business Overview
12.3.5 SABO Latest Developments
12.4 Cytec Industries
12.4.1 Cytec Industries Company Information
12.4.2 Cytec Industries UV Absorber Product Offered
12.4.3 Cytec Industries UV Absorber Sales, Revenue, Price and Gross Margin (2019-2021)
12.4.4 Cytec Industries Main Business Overview
12.4.5 Cytec Industries Latest Developments
12.5 Addivant
12.5.1 Addivant Company Information
12.5.2 Addivant UV Absorber Product Offered
12.5.3 Addivant UV Absorber Sales, Revenue, Price and Gross Margin (2019-2021)
12.5.4 Addivant Main Business Overview
12.5.5 Addivant Latest Developments
12.6 IGM Resins
12.6.1 IGM Resins Company Information
12.6.2 IGM Resins UV Absorber Product Offered
12.6.3 IGM Resins UV Absorber Sales, Revenue, Price and Gross Margin (2019-2021)
12.6.4 IGM Resins Main Business Overview
12.6.5 IGM Resins Latest Developments
12.7 Clariant
12.7.1 Clariant Company Information
12.7.2 Clariant UV Absorber Product Offered
12.7.3 Clariant UV Absorber Sales, Revenue, Price and Gross Margin (2019-2021)
12.7.4 Clariant Main Business Overview
12.7.5 Clariant Latest Developments
12.8 Vanderbilt Chemicals
12.8.1 Vanderbilt Chemicals Company Information
12.8.2 Vanderbilt Chemicals UV Absorber Product Offered
12.8.3 Vanderbilt Chemicals UV Absorber Sales, Revenue, Price and Gross Margin (2019-2021)
12.8.4 Vanderbilt Chemicals Main Business Overview
12.8.5 Vanderbilt Chemicals Latest Developments
12.9 Lycus
12.9.1 Lycus Company Information
12.9.2 Lycus UV Absorber Product Offered
12.9.3 Lycus UV Absorber Sales, Revenue, Price and Gross Margin (2019-2021)
12.9.4 Lycus Main Business Overview
12.9.5 Lycus Latest Developments
12.10 DSM
12.10.1 DSM Company Information
12.10.2 DSM UV Absorber Product Offered
12.10.3 DSM UV Absorber Sales, Revenue, Price and Gross Margin (2019-2021)
12.10.4 DSM Main Business Overview
12.10.5 DSM Latest Developments
12.11 Wells Plastics
12.11.1 Wells Plastics Company Information
12.11.2 Wells Plastics UV Absorber Product Offered
12.11.3 Wells Plastics UV Absorber Sales, Revenue, Price and Gross Margin (2019-2021)
12.11.4 Wells Plastics Main Business Overview
12.11.5 Wells Plastics Latest Developments
12.12 Valtris
12.12.1 Valtris Company Information
12.12.2 Valtris UV Absorber Product Offered
12.12.3 Valtris UV Absorber Sales, Revenue, Price and Gross Margin (2019-2021)
12.12.4 Valtris Main Business Overview
12.12.5 Valtris Latest Developments
12.13 Yidu Huayang
12.13.1 Yidu Huayang Company Information
12.13.2 Yidu Huayang UV Absorber Product Offered
12.13.3 Yidu Huayang UV Absorber Sales, Revenue, Price and Gross Margin (2019-2021)
12.13.4 Yidu Huayang Main Business Overview
12.13.5 Yidu Huayang Latest Developments
12.14 Hangzhou Shinyang
12.14.1 Hangzhou Shinyang Company Information
12.14.2 Hangzhou Shinyang UV Absorber Product Offered
12.14.3 Hangzhou Shinyang UV Absorber Sales, Revenue, Price and Gross Margin (2019-2021)
12.14.4 Hangzhou Shinyang Main Business Overview
12.14.5 Hangzhou Shinyang Latest Developments
12.15 Beijing Tiangang
12.15.1 Beijing Tiangang Company Information
12.15.2 Beijing Tiangang UV Absorber Product Offered
12.15.3 Beijing Tiangang UV Absorber Sales, Revenue, Price and Gross Margin (2019-2021)
12.15.4 Beijing Tiangang Main Business Overview
12.15.5 Beijing Tiangang Latest Developments
12.16 Binhai Jinxiang
12.16.1 Binhai Jinxiang Company Information
12.16.2 Binhai Jinxiang UV Absorber Product Offered
12.16.3 Binhai Jinxiang UV Absorber Sales, Revenue, Price and Gross Margin (2019-2021)
12.16.4 Binhai Jinxiang Main Business Overview
12.16.5 Binhai Jinxiang Latest Developments
12.17 Runtec Chemical
12.17.1 Runtec Chemical Company Information
12.17.2 Runtec Chemical UV Absorber Product Offered
12.17.3 Runtec Chemical UV Absorber Sales, Revenue, Price and Gross Margin (2019-2021)
12.17.4 Runtec Chemical Main Business Overview
12.17.5 Runtec Chemical Latest Developments
12.18 Weihai Jinwei
12.18.1 Weihai Jinwei Company Information
12.18.2 Weihai Jinwei UV Absorber Product Offered
12.18.3 Weihai Jinwei UV Absorber Sales, Revenue, Price and Gross Margin (2019-2021)
12.18.4 Weihai Jinwei Main Business Overview
12.18.5 Weihai Jinwei Latest Developments
12.19 Everlight
12.19.1 Everlight Company Information
12.19.2 Everlight UV Absorber Product Offered
12.19.3 Everlight UV Absorber Sales, Revenue, Price and Gross Margin (2019-2021)
12.19.4 Everlight Main Business Overview
12.19.5 Everlight Latest Developments
12.20 Tianjin Rianlon
12.20.1 Tianjin Rianlon Company Information
12.20.2 Tianjin Rianlon UV Absorber Product Offered
12.20.3 Tianjin Rianlon UV Absorber Sales, Revenue, Price and Gross Margin (2019-2021)
12.20.4 Tianjin Rianlon Main Business Overview
12.20.5 Tianjin Rianlon Latest Developments
12.21 Hangzhou Jingyou
12.21.1 Hangzhou Jingyou Company Information
12.21.2 Hangzhou Jingyou UV Absorber Product Offered
12.21.3 Hangzhou Jingyou UV Absorber Sales, Revenue, Price and Gross Margin (2019-2021)
12.21.4 Hangzhou Jingyou Main Business Overview
12.21.5 Hangzhou Jingyou Latest Developments
12.22 Hongkun Group
12.22.1 Hongkun Group Company Information
12.22.2 Hongkun Group UV Absorber Product Offered
12.22.3 Hongkun Group UV Absorber Sales, Revenue, Price and Gross Margin (2019-2021)
12.22.4 Hongkun Group Main Business Overview
12.22.5 Hongkun Group Latest Developments
12.23 Changshan Kerun
12.23.1 Changshan Kerun Company Information
12.23.2 Changshan Kerun UV Absorber Product Offered
12.23.3 Changshan Kerun UV Absorber Sales, Revenue, Price and Gross Margin (2019-2021)
12.23.4 Changshan Kerun Main Business Overview
12.23.5 Changshan Kerun Latest Developments
13 Research Findings and Conclusion
List of TablesTable 1. UV Absorber Consumption CAGR by Region (2020-2026) & ($ Millions)
Table 2. Major Players of Salicylate Type
Table 3. Major Players of Benzotriazole Type
Table 4. Major Players of Benzophenone Type
Table 5. Major Players of Triazine Type
Table 6. Major Players of Other
Table 7. Global UV Absorber Sales by Type (2016-2021) & (K MT)
Table 8. Global UV Absorber Sales Market Share by Type (2016-2021)
Table 9. Global UV Absorber Revenue by Type (2016-2021) & ($ million)
Table 10. Global UV Absorber Revenue Market Share by Type (2016-2021)
Table 11. Global UV Absorber Sale Price by Type (2016-2021)
Table 12. Global UV Absorber Sales by Application (2016-2021) & (K MT)
Table 13. Global UV Absorber Sales Market Share by Application (2016-2021)
Table 14. Global UV Absorber Value by Application (2016-2021)
Table 15. Global UV Absorber Revenue Market Share by Application (2016-2021)
Table 16. Global UV Absorber Sale Price by Application (2016-2021)
Table 17. Global UV Absorber Sales by Company (2019-2021) & (K MT)
Table 18. Global UV Absorber Sales Market Share by Company (2019-2021)
Table 19. Global UV Absorber Revenue by Company (2019-2021) ($ Millions)
Table 20. Global UV Absorber Revenue Market Share by Company (2019-2021)
Table 21. Global UV Absorber Sale Price by Company (2019-2021)
Table 22. Key Manufacturers UV Absorber Producing Area Distribution and Sales Area
Table 23. Players UV Absorber Products Offered
Table 24. UV Absorber Concentration Ratio (CR3, CR5 and CR10) & (2019-2021)
Table 25. New Products and Potential Entrants
Table 26. Mergers & Acquisitions, Expansion
Table 27. Global UV Absorber Sales by Region (2016-2021) (K MT)
Table 28. Global UV Absorber Sales Market Share by Region (2016-2021)
Table 29. Global UV Absorber Revenue by Region (2016-2021) & ($ Millions)
Table 30. Global UV Absorber Revenue Market Share by Region (2016-2021)
Table 31. Americas UV Absorber Sales by Country (2016-2021) & (K MT)
Table 32. Americas UV Absorber Sales Market Share by Country (2016-2021)
Table 33. Americas UV Absorber Revenue by Country (2016-2021) & ($ Millions)
Table 34. Americas UV Absorber Revenue Market Share by Country (2016-2021)
Table 35. Americas UV Absorber Sales by Type (2016-2021) & (K MT)
Table 36. Americas UV Absorber Sales Market Share by Type (2016-2021)
Table 37. Americas UV Absorber Sales by Application (2016-2021) & (K MT)
Table 38. Americas UV Absorber Sales Market Share by Application (2016-2021)
Table 39. APAC UV Absorber Sales by Region (2016-2021) & (K MT)
Table 40. APAC UV Absorber Sales Market Share by Region (2016-2021)
Table 41. APAC UV Absorber Revenue by Region (2016-2021) & ($ Millions)
Table 42. APAC UV Absorber Revenue Market Share by Region (2016-2021)
Table 43. APAC UV Absorber Sales by Type (2016-2021) & (K MT)
Table 44. APAC UV Absorber Sales Market Share by Type (2016-2021)
Table 45. APAC UV Absorber Sales by Application (2016-2021) & (K MT)
Table 46. APAC UV Absorber Sales Market Share by Application (2016-2021)
Table 47. Europe UV Absorber Sales by Country (2016-2021) & (K MT)
Table 48. Europe UV Absorber Sales Market Share by Country (2016-2021)
Table 49. Europe UV Absorber Revenue by Country (2016-2021) & ($ Millions)
Table 50. Europe UV Absorber Revenue Market Share by Country (2016-2021)
Table 51. Europe UV Absorber Sales by Type (2016-2021) & (K MT)
Table 52. Europe UV Absorber Sales Market Share by Type (2016-2021)
Table 53. Europe UV Absorber Sales by Application (2016-2021) & (K MT)
Table 54. Europe UV Absorber Sales Market Share by Application (2016-2021)
Table 55. Middle East & Africa UV Absorber Sales by Country (2016-2021) & (K MT)
Table 56. Middle East & Africa UV Absorber Sales Market Share by Country (2016-2021)
Table 57. Middle East & Africa UV Absorber Revenue by Country (2016-2021) & ($ Millions)
Table 58. Middle East & Africa UV Absorber Revenue Market Share by Country (2016-2021)
Table 59. Middle East & Africa UV Absorber Sales by Type (2016-2021) & (K MT)
Table 60. Middle East & Africa UV Absorber Sales Market Share by Type (2016-2021)
Table 61. Middle East & Africa UV Absorber Sales by Application (2016-2021) & (K MT)
Table 62. Middle East & Africa UV Absorber Sales Market Share by Application (2016-2021)
Table 63. Global UV Absorber Sales Forecast by Type (2021-2026) & (K MT)
Table 64. Global UV Absorber Sales Market Share Forecast by Type (2021-2026)
Table 65. Global UV Absorber Revenue Forecast by Type (2021-2026) & ($ Millions)
Table 66. Global UV Absorber Revenue Market Share Forecast by Type (2021-2026)
Table 67. Global UV Absorber Sales Forecast by Application (2021-2026) & (K MT)
Table 68. Global UV Absorber Sales Market Share Forecast by Application (2021-2026)
Table 69. Global UV Absorber Revenue Forecast by Application (2021-2026) & ($ Millions)
Table 70. Global UV Absorber Revenue Market Share Forecast by Application (2021-2026)
Table 71. ADEKA Basic Information, UV Absorber Manufacturing Base, Sales Area and Its Competitors
Table 72. ADEKA UV Absorber Product Offered
Table 73. ADEKA UV Absorber Sales (K MT), Revenue ($ Million), Price (USD/MT) and Gross Margin (2019-2021E)
Table 74. ADEKA Main Business
Table 75. ADEKA Latest Developments
Table 76. Mayzo Basic Information, UV Absorber Manufacturing Base, Sales Area and Its Competitors
Table 77. Mayzo UV Absorber Product Offered
Table 78. Mayzo UV Absorber Sales (K MT), Revenue ($ Million), Price (USD/MT) and Gross Margin (2019-2021E)
Table 79. Mayzo Main Business
Table 80. Mayzo Latest Developments
Table 81. SABO Basic Information, UV Absorber Manufacturing Base, Sales Area and Its Competitors
Table 82. SABO UV Absorber Product Offered
Table 83. SABO UV Absorber Sales (K MT), Revenue ($ Million), Price (USD/MT) and Gross Margin (2019-2021E)
Table 84. SABO Main Business
Table 85. SABO Latest Developments
Table 86. Cytec Industries Basic Information, UV Absorber Manufacturing Base, Sales Area and Its Competitors
Table 87. Cytec Industries UV Absorber Product Offered
Table 88. Cytec Industries UV Absorber Sales (K MT), Revenue ($ Million), Price (USD/MT) and Gross Margin (2019-2021E)
Table 89. Cytec Industries Main Business
Table 90. Cytec Industries Latest Developments
Table 91. Addivant Basic Information, UV Absorber Manufacturing Base, Sales Area and Its Competitors
Table 92. Addivant UV Absorber Product Offered
Table 93. Addivant UV Absorber Sales (K MT), Revenue ($ Million), Price (USD/MT) and Gross Margin (2019-2021E)
Table 94. Addivant Main Business
Table 95. Addivant Latest Developments
Table 96. IGM Resins Basic Information, UV Absorber Manufacturing Base, Sales Area and Its Competitors
Table 97. IGM Resins UV Absorber Product Offered
Table 98. IGM Resins UV Absorber Sales (K MT), Revenue ($ Million), Price (USD/MT) and Gross Margin (2019-2021E)
Table 99. IGM Resins Main Business
Table 100. IGM Resins Latest Developments
Table 101. Clariant Basic Information, UV Absorber Manufacturing Base, Sales Area and Its Competitors
Table 102. Clariant UV Absorber Product Offered
Table 103. Clariant UV Absorber Sales (K MT), Revenue ($ Million), Price (USD/MT) and Gross Margin (2019-2021E)
Table 104. Clariant Main Business
Table 105. Clariant Latest Developments
Table 106. Vanderbilt Chemicals Basic Information, UV Absorber Manufacturing Base, Sales Area and Its Competitors
Table 107. Vanderbilt Chemicals UV Absorber Product Offered
Table 108. Vanderbilt Chemicals UV Absorber Sales (K MT), Revenue ($ Million), Price (USD/MT) and Gross Margin (2019-2021E)
Table 109. Vanderbilt Chemicals Main Business
Table 110. Vanderbilt Chemicals Latest Developments
Table 111. Lycus Basic Information, UV Absorber Manufacturing Base, Sales Area and Its Competitors
Table 112. Lycus UV Absorber Product Offered
Table 113. Lycus UV Absorber Sales (K MT), Revenue ($ Million), Price (USD/MT) and Gross Margin (2019-2021E)
Table 114. Lycus Main Business
Table 115. Lycus Latest Developments
Table 116. DSM Basic Information, UV Absorber Manufacturing Base, Sales Area and Its Competitors
Table 117. DSM UV Absorber Product Offered
Table 118. DSM UV Absorber Sales (K MT), Revenue ($ Million), Price (USD/MT) and Gross Margin (2019-2021E)
Table 119. DSM Main Business
Table 120. DSM Latest Developments
Table 121. Wells Plastics Basic Information, UV Absorber Manufacturing Base, Sales Area and Its Competitors
Table 122. Wells Plastics UV Absorber Product Offered
Table 123. Wells Plastics UV Absorber Sales (K MT), Revenue ($ Million), Price (USD/MT) and Gross Margin (2019-2021E)
Table 124. Wells Plastics Main Business
Table 125. Wells Plastics Latest Developments
Table 126. Valtris Basic Information, UV Absorber Manufacturing Base, Sales Area and Its Competitors
Table 127. Valtris UV Absorber Product Offered
Table 128. Valtris UV Absorber Sales (K MT), Revenue ($ Million), Price (USD/MT) and Gross Margin (2019-2021E)
Table 129. Valtris Main Business
Table 130. Valtris Latest Developments
Table 131. Yidu Huayang Basic Information, UV Absorber Manufacturing Base, Sales Area and Its Competitors
Table 132. Yidu Huayang UV Absorber Product Offered
Table 133. Yidu Huayang UV Absorber Sales (K MT), Revenue ($ Million), Price (USD/MT) and Gross Margin (2019-2021E)
Table 134. Yidu Huayang Main Business
Table 135. Yidu Huayang Latest Developments
Table 136. Hangzhou Shinyang Basic Information, UV Absorber Manufacturing Base, Sales Area and Its Competitors
Table 137. Hangzhou Shinyang UV Absorber Product Offered
Table 138. Hangzhou Shinyang UV Absorber Sales (K MT), Revenue ($ Million), Price (USD/MT) and Gross Margin (2019-2021E)
Table 139. Hangzhou Shinyang Main Business
Table 140. Hangzhou Shinyang Latest Developments
Table 141. Beijing Tiangang Basic Information, UV Absorber Manufacturing Base, Sales Area and Its Competitors
Table 142. Beijing Tiangang UV Absorber Product Offered
Table 143. Beijing Tiangang UV Absorber Sales (K MT), Revenue ($ Million), Price (USD/MT) and Gross Margin (2019-2021E)
Table 144. Beijing Tiangang Main Business
Table 145. Beijing Tiangang Latest Developments
Table 146. Binhai Jinxiang Basic Information, UV Absorber Manufacturing Base, Sales Area and Its Competitors
Table 147. Binhai Jinxiang UV Absorber Product Offered
Table 148. Binhai Jinxiang UV Absorber Sales (K MT), Revenue ($ Million), Price (USD/MT) and Gross Margin (2019-2021E)
Table 149. Binhai Jinxiang Main Business
Table 150. Binhai Jinxiang Latest Developments
Table 151. Runtec Chemical Basic Information, UV Absorber Manufacturing Base, Sales Area and Its Competitors
Table 152. Runtec Chemical UV Absorber Product Offered
Table 153. Runtec Chemical UV Absorber Sales (K MT), Revenue ($ Million), Price (USD/MT) and Gross Margin (2019-2021E)
Table 154. Runtec Chemical Main Business
Table 155. Runtec Chemical Latest Developments
Table 156. Weihai Jinwei Basic Information, UV Absorber Manufacturing Base, Sales Area and Its Competitors
Table 157. Weihai Jinwei UV Absorber Product Offered
Table 158. Weihai Jinwei UV Absorber Sales (K MT), Revenue ($ Million), Price (USD/MT) and Gross Margin (2019-2021E)
Table 159. Weihai Jinwei Main Business
Table 160. Weihai Jinwei Latest Developments
Table 161. Everlight Basic Information, UV Absorber Manufacturing Base, Sales Area and Its Competitors
Table 162. Everlight UV Absorber Product Offered
Table 163. Everlight UV Absorber Sales (K MT), Revenue ($ Million), Price (USD/MT) and Gross Margin (2019-2021E)
Table 164. Everlight Main Business
Table 165. Everlight Latest Developments
Table 166. Tianjin Rianlon Basic Information, UV Absorber Manufacturing Base, Sales Area and Its Competitors
Table 167. Tianjin Rianlon UV Absorber Product Offered
Table 168. Tianjin Rianlon UV Absorber Sales (K MT), Revenue ($ Million), Price (USD/MT) and Gross Margin (2019-2021E)
Table 169. Tianjin Rianlon Main Business
Table 170. Tianjin Rianlon Latest Developments
Table 171. Hangzhou Jingyou Basic Information, UV Absorber Manufacturing Base, Sales Area and Its Competitors
Table 172. Hangzhou Jingyou UV Absorber Product Offered
Table 173. Hangzhou Jingyou UV Absorber Sales (K MT), Revenue ($ Million), Price (USD/MT) and Gross Margin (2019-2021E)
Table 174. Hangzhou Jingyou Main Business
Table 175. Hangzhou Jingyou Latest Developments
Table 176. Hongkun Group Basic Information, UV Absorber Manufacturing Base, Sales Area and Its Competitors
Table 177. Hongkun Group UV Absorber Product Offered
Table 178. Hongkun Group UV Absorber Sales (K MT), Revenue ($ Million), Price (USD/MT) and Gross Margin (2019-2021E)
Table 179. Hongkun Group Main Business
Table 180. Hongkun Group Latest Developments
Table 181. Changshan Kerun Basic Information, UV Absorber Manufacturing Base, Sales Area and Its Competitors
Table 182. Changshan Kerun UV Absorber Product Offered
Table 183. Changshan Kerun UV Absorber Sales (K MT), Revenue ($ Million), Price (USD/MT) and Gross Margin (2019-2021E)
Table 184. Changshan Kerun Main Business
Table 185. Changshan Kerun Latest Developments
List of Figures
Figure 1. Picture of UV Absorber
Figure 2. UV Absorber Report Years Considered
Figure 3. Research Objectives
Figure 4. Research Methodology
Figure 5. Research Process and Data Source
Figure 6. Global UV Absorber Sales Growth Rate 2016-2026 (K MT)
Figure 7. Global UV Absorber Revenue Growth Rate 2016-2026 ($ Millions)
Figure 8. UV Absorber Sales by Region (2021 & 2026) & ($ millions)
Figure 9. Product Picture of Salicylate Type
Figure 10. Product Picture of Benzotriazole Type
Figure 11. Product Picture of Benzophenone Type
Figure 12. Product Picture of Triazine Type
Figure 13. Product Picture of Other
Figure 14. Global UV Absorber Sales Market Share by Type in 2020
Figure 15. Global UV Absorber Revenue Market Share by Type (2016-2021)
Figure 16. UV Absorber Consumed in Plastic Products
Figure 17. Global UV Absorber Market: Plastic Products (2016-2021) & (K MT)
Figure 18. UV Absorber Consumed in Polyester
Figure 19. Global UV Absorber Market: Polyester (2016-2021) & (K MT)
Figure 20. UV Absorber Consumed in Chlorine Polyester
Figure 21. Global UV Absorber Market: Chlorine Polyester (2016-2021) & (K MT)
Figure 22. UV Absorber Consumed in Polyvinyl Chloride
Figure 23. Global UV Absorber Market: Polyvinyl Chloride (2016-2021) & (K MT)
Figure 24. UV Absorber Consumed in Other
Figure 25. Global UV Absorber Market: Other (2016-2021) & (K MT)
Figure 26. Global UV Absorber Sales Market Share by Application (2016-2021)
Figure 27. Global UV Absorber Revenue Market Share by Application in 2020
Figure 28. Global UV Absorber Revenue Market by Company in 2020 ($ Million)
Figure 29. Global UV Absorber Revenue Market Share by Company in 2020
Figure 30. Global UV Absorber Sales Market Share by Regions (2016-2021)
Figure 31. Global UV Absorber Revenue Market Share by Region in 2020
Figure 32. Americas UV Absorber Sales 2016-2021 (K MT)
Figure 33. Americas UV Absorber Revenue 2016-2021 ($ Millions)
Figure 34. APAC UV Absorber Sales 2016-2021 (K MT)
Figure 35. APAC UV Absorber Revenue 2016-2021 ($ Millions)
Figure 36. Europe UV Absorber Sales 2016-2021 (K MT)
Figure 37. Europe UV Absorber Revenue 2016-2021 ($ Millions)
Figure 38. Middle East & Africa UV Absorber Sales 2016-2021 (K MT)
Figure 39. Middle East & Africa UV Absorber Revenue 2016-2021 ($ Millions)
Figure 40. Americas UV Absorber Sales Market Share by Country in 2020
Figure 41. Americas UV Absorber Revenue Market Share by Country in 2020
Figure 42. Americas UV Absorber Sales Market Share by Type in 2020
Figure 43. Americas UV Absorber Sales Market Share by Application in 2020
Figure 44. United States UV Absorber Revenue Growth 2016-2021 ($ Millions)
Figure 45. Canada UV Absorber Revenue Growth 2016-2021 ($ Millions)
Figure 46. Mexico UV Absorber Revenue Growth 2016-2021 ($ Millions)
Figure 47. Brazil UV Absorber Revenue Growth 2016-2021 ($ Millions)
Figure 48. APAC UV Absorber Sales Market Share by Region in 2020
Figure 49. APAC UV Absorber Revenue Market Share by Regions in 2020
Figure 50. APAC UV Absorber Sales Market Share by Type in 2020
Figure 51. APAC UV Absorber Sales Market Share by Application in 2020
Figure 52. China UV Absorber Revenue Growth 2016-2021 ($ Millions)
Figure 53. Japan UV Absorber Revenue Growth 2016-2021 ($ Millions)
Figure 54. Korea UV Absorber Revenue Growth 2016-2021 ($ Millions)
Figure 55. Southeast Asia UV Absorber Revenue Growth 2016-2021 ($ Millions)
Figure 56. India UV Absorber Revenue Growth 2016-2021 ($ Millions)
Figure 57. Australia UV Absorber Revenue Growth 2016-2021 ($ Millions)
Figure 58. Europe UV Absorber Sales Market Share by Country in 2020
Figure 59. Europe UV Absorber Revenue Market Share by Country in 2020
Figure 60. Europe UV Absorber Sales Market Share by Type in 2020
Figure 61. Europe UV Absorber Sales Market Share by Application in 2020
Figure 62. Germany UV Absorber Revenue Growth 2016-2021 ($ Millions)
Figure 63. France UV Absorber Revenue Growth 2016-2021 ($ Millions)
Figure 64. UK UV Absorber Revenue Growth 2016-2021 ($ Millions)
Figure 65. Italy UV Absorber Revenue Growth 2016-2021 ($ Millions)
Figure 66. Russia UV Absorber Revenue Growth 2016-2021 ($ Millions)
Figure 67. Middle East & Africa UV Absorber Sales Market Share by Country in 2020
Figure 68. Middle East & Africa UV Absorber Revenue Market Share by Country in 2020
Figure 69. Middle East & Africa UV Absorber Sales Market Share by Type in 2020
Figure 70. Middle East & Africa UV Absorber Sales Market Share by Application in 2020
Figure 71. Egypt UV Absorber Revenue Growth 2016-2021 ($ Millions)
Figure 72. South Africa UV Absorber Revenue Growth 2016-2021 ($ Millions)
Figure 73. Israel UV Absorber Revenue Growth 2016-2021 ($ Millions)
Figure 74. Turkey UV Absorber Revenue Growth 2016-2021 ($ Millions)
Figure 75. GCC Country UV Absorber Revenue Growth 2016-2021 ($ Millions)
Figure 76. Channels of Distribution
Figure 77. Distributors Profiles
【免責事項】
https://www.globalresearch.jp/disclaimer