1 Scope of the Report
1.1 Market Introduction
1.2 Years Considered
1.3 Research Objectives
1.4 Market Research Methodology
1.5 Research Process and Data Source
1.6 Economic Indicators
1.7 Currency Considered
2 Executive Summary
2.1 World Market Overview
2.1.1 Global Stone Plastic Floor Consumption 2016-2026
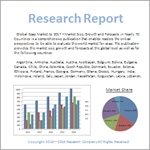
2.1.2 Stone Plastic Floor Consumption CAGR by Region
2.2 Stone Plastic Floor Segment by Type
2.2.1 Anti-static Type
2.2.2 Anti-slip Type
2.3 Stone Plastic Floor Sales by Type
2.3.1 Global Stone Plastic Floor Sales Market Share by Type (2016-2021)
2.3.2 Global Stone Plastic Floor Revenue and Market Share by Type (2016-2021)
2.3.3 Global Stone Plastic Floor Sale Price by Type (2016-2021)
2.4 Stone Plastic Floor Segment by Application
2.4.1 Mall
2.4.2 Airport
2.4.3 Hospital
2.4.4 School
2.4.5 Supermarket
2.4.6 Factory
2.4.7 Library
2.4.8 Car Showroom
2.4.9 Other
2.5 Stone Plastic Floor Sales by Application
2.5.1 Global Stone Plastic Floor Sale Market Share by Application (2016-2021)
2.5.2 Global Stone Plastic Floor Revenue and Market Share by Application (2016-2021)
2.5.3 Global Stone Plastic Floor Sale Price by Application (2016-2021)
3 Global Stone Plastic Floor by Company
3.1 Global Stone Plastic Floor Sales Market Share by Company
3.1.1 Global Stone Plastic Floor Sales by Company (2019-2021)
3.1.2 Global Stone Plastic Floor Sales Market Share by Company (2019-2021)
3.2 Global Stone Plastic Floor Revenue Market Share by Company
3.2.1 Global Stone Plastic Floor Revenue by Company (2019-2021)
3.2.2 Global Stone Plastic Floor Revenue Market Share by Company (2019-2021)
3.3 Global Stone Plastic Floor Sale Price by Company
3.4 Global Manufacturers Stone Plastic Floor Producing Area Distribution, Sales Area, Product Type
3.4.1 Key Manufacturers Stone Plastic Floor Product Location Distribution
3.4.2 Players Stone Plastic Floor Products Offered
3.5 Market Concentration Rate Analysis
3.5.1 Competition Landscape Analysis
3.5.2 Concentration Ratio (CR3, CR5 and CR10) & (2019-2021)
3.6 New Products and Potential Entrants
3.7 Mergers & Acquisitions, Expansion
4 Stone Plastic Floor by Region
4.1 Global Stone Plastic Floor by Region
4.1.1 Global Stone Plastic Floor Sales by Region
4.1.2 Global Stone Plastic Floor Revenue by Region
4.2 Americas Stone Plastic Floor Sales Growth
4.3 APAC Stone Plastic Floor Sales Growth
4.4 Europe Stone Plastic Floor Sales Growth
4.5 Middle East & Africa Stone Plastic Floor Sales Growth
5 Americas
5.1 Americas Stone Plastic Floor Sales by Country
5.1.1 Americas Stone Plastic Floor Sales by Country (2016-2021)
5.1.2 Americas Stone Plastic Floor Revenue by Country (2016-2021)
5.2 Americas Stone Plastic Floor Sales by Type
5.3 Americas Stone Plastic Floor Sales by Application
5.4 United States
5.5 Canada
5.6 Mexico
5.7 Brazil
6 APAC
6.1 APAC Stone Plastic Floor Sales by Region
6.1.1 APAC Stone Plastic Floor Sales by Region (2016-2021)
6.1.2 APAC Stone Plastic Floor Revenue by Region (2016-2021)
6.2 APAC Stone Plastic Floor Sales by Type
6.3 APAC Stone Plastic Floor Sales by Application
6.4 China
6.5 Japan
6.6 Korea
6.7 Southeast Asia
6.8 India
6.9 Australia
7 Europe
7.1 Europe Stone Plastic Floor by Country
7.1.1 Europe Stone Plastic Floor Sales by Country (2016-2021)
7.1.2 Europe Stone Plastic Floor Revenue by Country (2016-2021)
7.2 Europe Stone Plastic Floor Sales by Type
7.3 Europe Stone Plastic Floor Sales by Application
7.4 Germany
7.5 France
7.6 UK
7.7 Italy
7.8 Russia
8 Middle East & Africa
8.1 Middle East & Africa Stone Plastic Floor by Country
8.1.1 Middle East & Africa Stone Plastic Floor Sales by Country (2016-2021)
8.1.2 Middle East & Africa Stone Plastic Floor Revenue by Country (2016-2021)
8.2 Middle East & Africa Stone Plastic Floor Sales by Type
8.3 Middle East & Africa Stone Plastic Floor Sales by Application
8.4 Egypt
8.5 South Africa
8.6 Israel
8.7 Turkey
8.8 GCC Country
9 Market Drivers, Challenges and Trends
9.1 Market Drivers and Impact
9.1.1 Growing Demand from Key Regions
9.1.2 Growing Demand from Key Applications and Potential Industries
9.2 Market Challenges and Impact
9.3 Market Trends
10 Marketing, Distributors and Customer
10.1 Sales Channel
10.1.1 Direct Channels
10.1.2 Indirect Channels
10.2 Stone Plastic Floor Distributors
10.3 Stone Plastic Floor Customer
11 Global Stone Plastic Floor Market Forecast
11.1 Global Stone Plastic Floor Forecast by Region
11.1.1 Global Stone Plastic Floor Forecast by Regions (2021-2026)
11.2.2 Global Stone Plastic Floor Revenue Forecast by Regions (2021-2026)
11.2 Americas Forecast by Country
11.3 APAC Forecast by Region
11.4 Europe Forecast by Country
11.5 Middle East & Africa Forecast by Country
11.6 Global Stone Plastic Floor Forecast by Type
11.7 Global Stone Plastic Floor Forecast by Application
12 Key Players Analysis
12.1 Armstrong Flooring
12.1.1 Armstrong Flooring Company Information
12.1.2 Armstrong Flooring Stone Plastic Floor Product Offered
12.1.3 Armstrong Flooring Stone Plastic Floor Sales, Revenue, Price and Gross Margin (2019-2021)
12.1.4 Armstrong Flooring Main Business Overview
12.1.5 Armstrong Flooring Latest Developments
12.2 Decno Group
12.2.1 Decno Group Company Information
12.2.2 Decno Group Stone Plastic Floor Product Offered
12.2.3 Decno Group Stone Plastic Floor Sales, Revenue, Price and Gross Margin (2019-2021)
12.2.4 Decno Group Main Business Overview
12.2.5 Decno Group Latest Developments
12.3 CFL Flooring
12.3.1 CFL Flooring Company Information
12.3.2 CFL Flooring Stone Plastic Floor Product Offered
12.3.3 CFL Flooring Stone Plastic Floor Sales, Revenue, Price and Gross Margin (2019-2021)
12.3.4 CFL Flooring Main Business Overview
12.3.5 CFL Flooring Latest Developments
12.4 Zhejiang Oufei New Material
12.4.1 Zhejiang Oufei New Material Company Information
12.4.2 Zhejiang Oufei New Material Stone Plastic Floor Product Offered
12.4.3 Zhejiang Oufei New Material Stone Plastic Floor Sales, Revenue, Price and Gross Margin (2019-2021)
12.4.4 Zhejiang Oufei New Material Main Business Overview
12.4.5 Zhejiang Oufei New Material Latest Developments
12.5 Zhengfu Plastic
12.5.1 Zhengfu Plastic Company Information
12.5.2 Zhengfu Plastic Stone Plastic Floor Product Offered
12.5.3 Zhengfu Plastic Stone Plastic Floor Sales, Revenue, Price and Gross Margin (2019-2021)
12.5.4 Zhengfu Plastic Main Business Overview
12.5.5 Zhengfu Plastic Latest Developments
12.6 Zhejiang GIMIG Technology
12.6.1 Zhejiang GIMIG Technology Company Information
12.6.2 Zhejiang GIMIG Technology Stone Plastic Floor Product Offered
12.6.3 Zhejiang GIMIG Technology Stone Plastic Floor Sales, Revenue, Price and Gross Margin (2019-2021)
12.6.4 Zhejiang GIMIG Technology Main Business Overview
12.6.5 Zhejiang GIMIG Technology Latest Developments
12.7 Chenxing Group
12.7.1 Chenxing Group Company Information
12.7.2 Chenxing Group Stone Plastic Floor Product Offered
12.7.3 Chenxing Group Stone Plastic Floor Sales, Revenue, Price and Gross Margin (2019-2021)
12.7.4 Chenxing Group Main Business Overview
12.7.5 Chenxing Group Latest Developments
12.8 Hiking Group
12.8.1 Hiking Group Company Information
12.8.2 Hiking Group Stone Plastic Floor Product Offered
12.8.3 Hiking Group Stone Plastic Floor Sales, Revenue, Price and Gross Margin (2019-2021)
12.8.4 Hiking Group Main Business Overview
12.8.5 Hiking Group Latest Developments
12.9 Shanghai 3C Industrial
12.9.1 Shanghai 3C Industrial Company Information
12.9.2 Shanghai 3C Industrial Stone Plastic Floor Product Offered
12.9.3 Shanghai 3C Industrial Stone Plastic Floor Sales, Revenue, Price and Gross Margin (2019-2021)
12.9.4 Shanghai 3C Industrial Main Business Overview
12.9.5 Shanghai 3C Industrial Latest Developments
12.10 Changzhou Aipu Decorative Materials
12.10.1 Changzhou Aipu Decorative Materials Company Information
12.10.2 Changzhou Aipu Decorative Materials Stone Plastic Floor Product Offered
12.10.3 Changzhou Aipu Decorative Materials Stone Plastic Floor Sales, Revenue, Price and Gross Margin (2019-2021)
12.10.4 Changzhou Aipu Decorative Materials Main Business Overview
12.10.5 Changzhou Aipu Decorative Materials Latest Developments
12.11 Changzhou Lingdian
12.11.1 Changzhou Lingdian Company Information
12.11.2 Changzhou Lingdian Stone Plastic Floor Product Offered
12.11.3 Changzhou Lingdian Stone Plastic Floor Sales, Revenue, Price and Gross Margin (2019-2021)
12.11.4 Changzhou Lingdian Main Business Overview
12.11.5 Changzhou Lingdian Latest Developments
12.12 NewBetter Building Materials
12.12.1 NewBetter Building Materials Company Information
12.12.2 NewBetter Building Materials Stone Plastic Floor Product Offered
12.12.3 NewBetter Building Materials Stone Plastic Floor Sales, Revenue, Price and Gross Margin (2019-2021)
12.12.4 NewBetter Building Materials Main Business Overview
12.12.5 NewBetter Building Materials Latest Developments
12.13 Tops Flooring
12.13.1 Tops Flooring Company Information
12.13.2 Tops Flooring Stone Plastic Floor Product Offered
12.13.3 Tops Flooring Stone Plastic Floor Sales, Revenue, Price and Gross Margin (2019-2021)
12.13.4 Tops Flooring Main Business Overview
12.13.5 Tops Flooring Latest Developments
12.14 Yestrong
12.14.1 Yestrong Company Information
12.14.2 Yestrong Stone Plastic Floor Product Offered
12.14.3 Yestrong Stone Plastic Floor Sales, Revenue, Price and Gross Margin (2019-2021)
12.14.4 Yestrong Main Business Overview
12.14.5 Yestrong Latest Developments
12.15 Jining Luxing Plates
12.15.1 Jining Luxing Plates Company Information
12.15.2 Jining Luxing Plates Stone Plastic Floor Product Offered
12.15.3 Jining Luxing Plates Stone Plastic Floor Sales, Revenue, Price and Gross Margin (2019-2021)
12.15.4 Jining Luxing Plates Main Business Overview
12.15.5 Jining Luxing Plates Latest Developments
12.16 MUCHSEE Wood
12.16.1 MUCHSEE Wood Company Information
12.16.2 MUCHSEE Wood Stone Plastic Floor Product Offered
12.16.3 MUCHSEE Wood Stone Plastic Floor Sales, Revenue, Price and Gross Margin (2019-2021)
12.16.4 MUCHSEE Wood Main Business Overview
12.16.5 MUCHSEE Wood Latest Developments
12.17 Jiangsu Zhengyoung Flooring
12.17.1 Jiangsu Zhengyoung Flooring Company Information
12.17.2 Jiangsu Zhengyoung Flooring Stone Plastic Floor Product Offered
12.17.3 Jiangsu Zhengyoung Flooring Stone Plastic Floor Sales, Revenue, Price and Gross Margin (2019-2021)
12.17.4 Jiangsu Zhengyoung Flooring Main Business Overview
12.17.5 Jiangsu Zhengyoung Flooring Latest Developments
13 Research Findings and Conclusion
List of TablesTable 1. Stone Plastic Floor Consumption CAGR by Region (2020-2026) & ($ Millions)
Table 2. Major Players of Anti-static Type
Table 3. Major Players of Anti-slip Type
Table 4. Global Stone Plastic Floor Sales by Type (2016-2021) & (KSqm)
Table 5. Global Stone Plastic Floor Sales Market Share by Type (2016-2021)
Table 6. Global Stone Plastic Floor Revenue by Type (2016-2021) & ($ million)
Table 7. Global Stone Plastic Floor Revenue Market Share by Type (2016-2021)
Table 8. Global Stone Plastic Floor Sale Price by Type (2016-2021)
Table 9. Global Stone Plastic Floor Sales by Application (2016-2021) & (KSqm)
Table 10. Global Stone Plastic Floor Sales Market Share by Application (2016-2021)
Table 11. Global Stone Plastic Floor Value by Application (2016-2021)
Table 12. Global Stone Plastic Floor Revenue Market Share by Application (2016-2021)
Table 13. Global Stone Plastic Floor Sale Price by Application (2016-2021)
Table 14. Global Stone Plastic Floor Sales by Company (2019-2021) & (KSqm)
Table 15. Global Stone Plastic Floor Sales Market Share by Company (2019-2021)
Table 16. Global Stone Plastic Floor Revenue by Company (2019-2021) ($ Millions)
Table 17. Global Stone Plastic Floor Revenue Market Share by Company (2019-2021)
Table 18. Global Stone Plastic Floor Sale Price by Company (2019-2021)
Table 19. Key Manufacturers Stone Plastic Floor Producing Area Distribution and Sales Area
Table 20. Players Stone Plastic Floor Products Offered
Table 21. Stone Plastic Floor Concentration Ratio (CR3, CR5 and CR10) & (2019-2021)
Table 22. New Products and Potential Entrants
Table 23. Mergers & Acquisitions, Expansion
Table 24. Global Stone Plastic Floor Sales by Region (2016-2021) (KSqm)
Table 25. Global Stone Plastic Floor Sales Market Share by Region (2016-2021)
Table 26. Global Stone Plastic Floor Revenue by Region (2016-2021) & ($ Millions)
Table 27. Global Stone Plastic Floor Revenue Market Share by Region (2016-2021)
Table 28. Americas Stone Plastic Floor Sales by Country (2016-2021) & (KSqm)
Table 29. Americas Stone Plastic Floor Sales Market Share by Country (2016-2021)
Table 30. Americas Stone Plastic Floor Revenue by Country (2016-2021) & ($ Millions)
Table 31. Americas Stone Plastic Floor Revenue Market Share by Country (2016-2021)
Table 32. Americas Stone Plastic Floor Sales by Type (2016-2021) & (KSqm)
Table 33. Americas Stone Plastic Floor Sales Market Share by Type (2016-2021)
Table 34. Americas Stone Plastic Floor Sales by Application (2016-2021) & (KSqm)
Table 35. Americas Stone Plastic Floor Sales Market Share by Application (2016-2021)
Table 36. APAC Stone Plastic Floor Sales by Region (2016-2021) & (KSqm)
Table 37. APAC Stone Plastic Floor Sales Market Share by Region (2016-2021)
Table 38. APAC Stone Plastic Floor Revenue by Region (2016-2021) & ($ Millions)
Table 39. APAC Stone Plastic Floor Revenue Market Share by Region (2016-2021)
Table 40. APAC Stone Plastic Floor Sales by Type (2016-2021) & (KSqm)
Table 41. APAC Stone Plastic Floor Sales Market Share by Type (2016-2021)
Table 42. APAC Stone Plastic Floor Sales by Application (2016-2021) & (KSqm)
Table 43. APAC Stone Plastic Floor Sales Market Share by Application (2016-2021)
Table 44. Europe Stone Plastic Floor Sales by Country (2016-2021) & (KSqm)
Table 45. Europe Stone Plastic Floor Sales Market Share by Country (2016-2021)
Table 46. Europe Stone Plastic Floor Revenue by Country (2016-2021) & ($ Millions)
Table 47. Europe Stone Plastic Floor Revenue Market Share by Country (2016-2021)
Table 48. Europe Stone Plastic Floor Sales by Type (2016-2021) & (KSqm)
Table 49. Europe Stone Plastic Floor Sales Market Share by Type (2016-2021)
Table 50. Europe Stone Plastic Floor Sales by Application (2016-2021) & (KSqm)
Table 51. Europe Stone Plastic Floor Sales Market Share by Application (2016-2021)
Table 52. Middle East & Africa Stone Plastic Floor Sales by Country (2016-2021) & (KSqm)
Table 53. Middle East & Africa Stone Plastic Floor Sales Market Share by Country (2016-2021)
Table 54. Middle East & Africa Stone Plastic Floor Revenue by Country (2016-2021) & ($ Millions)
Table 55. Middle East & Africa Stone Plastic Floor Revenue Market Share by Country (2016-2021)
Table 56. Middle East & Africa Stone Plastic Floor Sales by Type (2016-2021) & (KSqm)
Table 57. Middle East & Africa Stone Plastic Floor Sales Market Share by Type (2016-2021)
Table 58. Middle East & Africa Stone Plastic Floor Sales by Application (2016-2021) & (KSqm)
Table 59. Middle East & Africa Stone Plastic Floor Sales Market Share by Application (2016-2021)
Table 60. Key and Potential Regions of Stone Plastic Floor
Table 61. Key Application and Potential Industries of Stone Plastic Floor
Table 62. Key Challenges of Stone Plastic Floor
Table 63. Key Trends of Stone Plastic Floor
Table 64. Stone Plastic Floor Distributors List
Table 65. Stone Plastic Floor Customer List
Table 66. Global Stone Plastic Floor Sales Forecast by Region (2021-2026) & (KSqm)
Table 67. Global Stone Plastic Floor Consumption Market Forecast by Region
Table 68. Global Stone Plastic Floor Revenue Forecast by Region (2021-2026) & ($ millions)
Table 69. Global Stone Plastic Floor Revenue Market Share Forecast by Region (2021-2026)
Table 70. Americas Stone Plastic Floor Sales Forecast by Country (2021-2026) & (KSqm)
Table 71. Americas Stone Plastic Floor Revenue Forecast by Country (2021-2026) & ($ millions)
Table 72. APAC Stone Plastic Floor Sales Forecast by Region (2021-2026) & (KSqm)
Table 73. APAC Stone Plastic Floor Revenue Forecast by Region (2021-2026) & ($ millions)
Table 74. Europe Stone Plastic Floor Sales Forecast by Country (2021-2026) & (KSqm)
Table 75. Europe Stone Plastic Floor Revenue Forecast by Country (2021-2026) & ($ millions)
Table 76. Middle East & Africa Stone Plastic Floor Sales Forecast by Country (2021-2026) & (KSqm)
Table 77. Middle East & Africa Stone Plastic Floor Revenue Forecast by Country (2021-2026) & ($ millions)
Table 78. Global Stone Plastic Floor Sales Forecast by Type (2021-2026) & (KSqm)
Table 79. Global Stone Plastic Floor Sales Market Share Forecast by Type (2021-2026)
Table 80. Global Stone Plastic Floor Revenue Forecast by Type (2021-2026) & ($ Millions)
Table 81. Global Stone Plastic Floor Revenue Market Share Forecast by Type (2021-2026)
Table 82. Global Stone Plastic Floor Sales Forecast by Application (2021-2026) & (KSqm)
Table 83. Global Stone Plastic Floor Sales Market Share Forecast by Application (2021-2026)
Table 84. Global Stone Plastic Floor Revenue Forecast by Application (2021-2026) & ($ Millions)
Table 85. Global Stone Plastic Floor Revenue Market Share Forecast by Application (2021-2026)
Table 86. Armstrong Flooring Basic Information, Stone Plastic Floor Manufacturing Base, Sales Area and Its Competitors
Table 87. Armstrong Flooring Stone Plastic Floor Product Offered
Table 88. Armstrong Flooring Stone Plastic Floor Sales (KSqm), Revenue ($ Million), Price (US$/Sqm) and Gross Margin (2019-2021E)
Table 89. Armstrong Flooring Main Business
Table 90. Armstrong Flooring Latest Developments
Table 91. Decno Group Basic Information, Stone Plastic Floor Manufacturing Base, Sales Area and Its Competitors
Table 92. Decno Group Stone Plastic Floor Product Offered
Table 93. Decno Group Stone Plastic Floor Sales (KSqm), Revenue ($ Million), Price (US$/Sqm) and Gross Margin (2019-2021E)
Table 94. Decno Group Main Business
Table 95. Decno Group Latest Developments
Table 96. CFL Flooring Basic Information, Stone Plastic Floor Manufacturing Base, Sales Area and Its Competitors
Table 97. CFL Flooring Stone Plastic Floor Product Offered
Table 98. CFL Flooring Stone Plastic Floor Sales (KSqm), Revenue ($ Million), Price (US$/Sqm) and Gross Margin (2019-2021E)
Table 99. CFL Flooring Main Business
Table 100. CFL Flooring Latest Developments
Table 101. Zhejiang Oufei New Material Basic Information, Stone Plastic Floor Manufacturing Base, Sales Area and Its Competitors
Table 102. Zhejiang Oufei New Material Stone Plastic Floor Product Offered
Table 103. Zhejiang Oufei New Material Stone Plastic Floor Sales (KSqm), Revenue ($ Million), Price (US$/Sqm) and Gross Margin (2019-2021E)
Table 104. Zhejiang Oufei New Material Main Business
Table 105. Zhejiang Oufei New Material Latest Developments
Table 106. Zhengfu Plastic Basic Information, Stone Plastic Floor Manufacturing Base, Sales Area and Its Competitors
Table 107. Zhengfu Plastic Stone Plastic Floor Product Offered
Table 108. Zhengfu Plastic Stone Plastic Floor Sales (KSqm), Revenue ($ Million), Price (US$/Sqm) and Gross Margin (2019-2021E)
Table 109. Zhengfu Plastic Main Business
Table 110. Zhengfu Plastic Latest Developments
Table 111. Zhejiang GIMIG Technology Basic Information, Stone Plastic Floor Manufacturing Base, Sales Area and Its Competitors
Table 112. Zhejiang GIMIG Technology Stone Plastic Floor Product Offered
Table 113. Zhejiang GIMIG Technology Stone Plastic Floor Sales (KSqm), Revenue ($ Million), Price (US$/Sqm) and Gross Margin (2019-2021E)
Table 114. Zhejiang GIMIG Technology Main Business
Table 115. Zhejiang GIMIG Technology Latest Developments
Table 116. Chenxing Group Basic Information, Stone Plastic Floor Manufacturing Base, Sales Area and Its Competitors
Table 117. Chenxing Group Stone Plastic Floor Product Offered
Table 118. Chenxing Group Stone Plastic Floor Sales (KSqm), Revenue ($ Million), Price (US$/Sqm) and Gross Margin (2019-2021E)
Table 119. Chenxing Group Main Business
Table 120. Chenxing Group Latest Developments
Table 121. Hiking Group Basic Information, Stone Plastic Floor Manufacturing Base, Sales Area and Its Competitors
Table 122. Hiking Group Stone Plastic Floor Product Offered
Table 123. Hiking Group Stone Plastic Floor Sales (KSqm), Revenue ($ Million), Price (US$/Sqm) and Gross Margin (2019-2021E)
Table 124. Hiking Group Main Business
Table 125. Hiking Group Latest Developments
Table 126. Shanghai 3C Industrial Basic Information, Stone Plastic Floor Manufacturing Base, Sales Area and Its Competitors
Table 127. Shanghai 3C Industrial Stone Plastic Floor Product Offered
Table 128. Shanghai 3C Industrial Stone Plastic Floor Sales (KSqm), Revenue ($ Million), Price (US$/Sqm) and Gross Margin (2019-2021E)
Table 129. Shanghai 3C Industrial Main Business
Table 130. Shanghai 3C Industrial Latest Developments
Table 131. Changzhou Aipu Decorative Materials Basic Information, Stone Plastic Floor Manufacturing Base, Sales Area and Its Competitors
Table 132. Changzhou Aipu Decorative Materials Stone Plastic Floor Product Offered
Table 133. Changzhou Aipu Decorative Materials Stone Plastic Floor Sales (KSqm), Revenue ($ Million), Price (US$/Sqm) and Gross Margin (2019-2021E)
Table 134. Changzhou Aipu Decorative Materials Main Business
Table 135. Changzhou Aipu Decorative Materials Latest Developments
Table 136. Changzhou Lingdian Basic Information, Stone Plastic Floor Manufacturing Base, Sales Area and Its Competitors
Table 137. Changzhou Lingdian Stone Plastic Floor Product Offered
Table 138. Changzhou Lingdian Stone Plastic Floor Sales (KSqm), Revenue ($ Million), Price (US$/Sqm) and Gross Margin (2019-2021E)
Table 139. Changzhou Lingdian Main Business
Table 140. Changzhou Lingdian Latest Developments
Table 141. NewBetter Building Materials Basic Information, Stone Plastic Floor Manufacturing Base, Sales Area and Its Competitors
Table 142. NewBetter Building Materials Stone Plastic Floor Product Offered
Table 143. NewBetter Building Materials Stone Plastic Floor Sales (KSqm), Revenue ($ Million), Price (US$/Sqm) and Gross Margin (2019-2021E)
Table 144. NewBetter Building Materials Main Business
Table 145. NewBetter Building Materials Latest Developments
Table 146. Tops Flooring Basic Information, Stone Plastic Floor Manufacturing Base, Sales Area and Its Competitors
Table 147. Tops Flooring Stone Plastic Floor Product Offered
Table 148. Tops Flooring Stone Plastic Floor Sales (KSqm), Revenue ($ Million), Price (US$/Sqm) and Gross Margin (2019-2021E)
Table 149. Tops Flooring Main Business
Table 150. Tops Flooring Latest Developments
Table 151. Yestrong Basic Information, Stone Plastic Floor Manufacturing Base, Sales Area and Its Competitors
Table 152. Yestrong Stone Plastic Floor Product Offered
Table 153. Yestrong Stone Plastic Floor Sales (KSqm), Revenue ($ Million), Price (US$/Sqm) and Gross Margin (2019-2021E)
Table 154. Yestrong Main Business
Table 155. Yestrong Latest Developments
Table 156. Jining Luxing Plates Basic Information, Stone Plastic Floor Manufacturing Base, Sales Area and Its Competitors
Table 157. Jining Luxing Plates Stone Plastic Floor Product Offered
Table 158. Jining Luxing Plates Stone Plastic Floor Sales (KSqm), Revenue ($ Million), Price (US$/Sqm) and Gross Margin (2019-2021E)
Table 159. Jining Luxing Plates Main Business
Table 160. Jining Luxing Plates Latest Developments
Table 161. MUCHSEE Wood Basic Information, Stone Plastic Floor Manufacturing Base, Sales Area and Its Competitors
Table 162. MUCHSEE Wood Stone Plastic Floor Product Offered
Table 163. MUCHSEE Wood Stone Plastic Floor Sales (KSqm), Revenue ($ Million), Price (US$/Sqm) and Gross Margin (2019-2021E)
Table 164. MUCHSEE Wood Main Business
Table 165. MUCHSEE Wood Latest Developments
Table 166. Jiangsu Zhengyoung Flooring Basic Information, Stone Plastic Floor Manufacturing Base, Sales Area and Its Competitors
Table 167. Jiangsu Zhengyoung Flooring Stone Plastic Floor Product Offered
Table 168. Jiangsu Zhengyoung Flooring Stone Plastic Floor Sales (KSqm), Revenue ($ Million), Price (US$/Sqm) and Gross Margin (2019-2021E)
Table 169. Jiangsu Zhengyoung Flooring Main Business
Table 170. Jiangsu Zhengyoung Flooring Latest Developments
List of Figures
Figure 1. Picture of Stone Plastic Floor
Figure 2. Stone Plastic Floor Report Years Considered
Figure 3. Research Objectives
Figure 4. Research Methodology
Figure 5. Research Process and Data Source
Figure 6. Global Stone Plastic Floor Sales Growth Rate 2016-2026 (KSqm)
Figure 7. Global Stone Plastic Floor Revenue Growth Rate 2016-2026 ($ Millions)
Figure 8. Stone Plastic Floor Sales by Region (2021 & 2026) & ($ millions)
Figure 9. Product Picture of Anti-static Type
Figure 10. Product Picture of Anti-slip Type
Figure 11. Global Stone Plastic Floor Sales Market Share by Type in 2020
Figure 12. Global Stone Plastic Floor Revenue Market Share by Type (2016-2021)
Figure 13. Stone Plastic Floor Consumed in Mall
Figure 14. Global Stone Plastic Floor Market: Mall (2016-2021) & (KSqm)
Figure 15. Stone Plastic Floor Consumed in Airport
Figure 16. Global Stone Plastic Floor Market: Airport (2016-2021) & (KSqm)
Figure 17. Stone Plastic Floor Consumed in Hospital
Figure 18. Global Stone Plastic Floor Market: Hospital (2016-2021) & (KSqm)
Figure 19. Stone Plastic Floor Consumed in School
Figure 20. Global Stone Plastic Floor Market: School (2016-2021) & (KSqm)
Figure 21. Stone Plastic Floor Consumed in Supermarket
Figure 22. Global Stone Plastic Floor Market: Supermarket (2016-2021) & (KSqm)
Figure 23. Stone Plastic Floor Consumed in Factory
Figure 24. Global Stone Plastic Floor Market: Factory (2016-2021) & (KSqm)
Figure 25. Stone Plastic Floor Consumed in Library
Figure 26. Global Stone Plastic Floor Market: Library (2016-2021) & (KSqm)
Figure 27. Stone Plastic Floor Consumed in Car Showroom
Figure 28. Global Stone Plastic Floor Market: Car Showroom (2016-2021) & (KSqm)
Figure 29. Stone Plastic Floor Consumed in Other
Figure 30. Global Stone Plastic Floor Market: Other (2016-2021) & (KSqm)
Figure 31. Global Stone Plastic Floor Sales Market Share by Application (2016-2021)
Figure 32. Global Stone Plastic Floor Revenue Market Share by Application in 2020
Figure 33. Stone Plastic Floor Revenue Market by Company in 2020 ($ Million)
Figure 34. Global Stone Plastic Floor Revenue Market Share by Company in 2020
Figure 35. Global Stone Plastic Floor Sales Market Share by Regions (2016-2021)
Figure 36. Global Stone Plastic Floor Revenue Market Share by Region in 2020
Figure 37. Americas Stone Plastic Floor Sales 2016-2021 (KSqm)
Figure 38. Americas Stone Plastic Floor Revenue 2016-2021 ($ Millions)
Figure 39. APAC Stone Plastic Floor Sales 2016-2021 (KSqm)
Figure 40. APAC Stone Plastic Floor Revenue 2016-2021 ($ Millions)
Figure 41. Europe Stone Plastic Floor Sales 2016-2021 (KSqm)
Figure 42. Europe Stone Plastic Floor Revenue 2016-2021 ($ Millions)
Figure 43. Middle East & Africa Stone Plastic Floor Sales 2016-2021 (KSqm)
Figure 44. Middle East & Africa Stone Plastic Floor Revenue 2016-2021 ($ Millions)
Figure 45. Americas Stone Plastic Floor Sales Market Share by Country in 2020
Figure 46. Americas Stone Plastic Floor Revenue Market Share by Country in 2020
Figure 47. Americas Stone Plastic Floor Sales Market Share by Type in 2020
Figure 48. Americas Stone Plastic Floor Sales Market Share by Application in 2020
Figure 49. United States Stone Plastic Floor Revenue Growth 2016-2021 ($ Millions)
Figure 50. Canada Stone Plastic Floor Revenue Growth 2016-2021 ($ Millions)
Figure 51. Mexico Stone Plastic Floor Revenue Growth 2016-2021 ($ Millions)
Figure 52. Brazil Stone Plastic Floor Revenue Growth 2016-2021 ($ Millions)
Figure 53. APAC Stone Plastic Floor Sales Market Share by Region in 2020
Figure 54. APAC Stone Plastic Floor Revenue Market Share by Regions in 2020
Figure 55. APAC Stone Plastic Floor Sales Market Share by Type in 2020
Figure 56. APAC Stone Plastic Floor Sales Market Share by Application in 2020
Figure 57. China Stone Plastic Floor Revenue Growth 2016-2021 ($ Millions)
Figure 58. Japan Stone Plastic Floor Revenue Growth 2016-2021 ($ Millions)
Figure 59. Korea Stone Plastic Floor Revenue Growth 2016-2021 ($ Millions)
Figure 60. Southeast Asia Stone Plastic Floor Revenue Growth 2016-2021 ($ Millions)
Figure 61. India Stone Plastic Floor Revenue Growth 2016-2021 ($ Millions)
Figure 62. Australia Stone Plastic Floor Revenue Growth 2016-2021 ($ Millions)
Figure 63. Europe Stone Plastic Floor Sales Market Share by Country in 2020
Figure 64. Europe Stone Plastic Floor Revenue Market Share by Country in 2020
Figure 65. Europe Stone Plastic Floor Sales Market Share by Type in 2020
Figure 66. Europe Stone Plastic Floor Sales Market Share by Application in 2020
Figure 67. Germany Stone Plastic Floor Revenue Growth 2016-2021 ($ Millions)
Figure 68. France Stone Plastic Floor Revenue Growth 2016-2021 ($ Millions)
Figure 69. UK Stone Plastic Floor Revenue Growth 2016-2021 ($ Millions)
Figure 70. Italy Stone Plastic Floor Revenue Growth 2016-2021 ($ Millions)
Figure 71. Russia Stone Plastic Floor Revenue Growth 2016-2021 ($ Millions)
Figure 72. Middle East & Africa Stone Plastic Floor Sales Market Share by Country in 2020
Figure 73. Middle East & Africa Stone Plastic Floor Revenue Market Share by Country in 2020
Figure 74. Middle East & Africa Stone Plastic Floor Sales Market Share by Type in 2020
Figure 75. Middle East & Africa Stone Plastic Floor Sales Market Share by Application in 2020
Figure 76. Egypt Stone Plastic Floor Revenue Growth 2016-2021 ($ Millions)
Figure 77. South Africa Stone Plastic Floor Revenue Growth 2016-2021 ($ Millions)
Figure 78. Israel Stone Plastic Floor Revenue Growth 2016-2021 ($ Millions)
Figure 79. Turkey Stone Plastic Floor Revenue Growth 2016-2021 ($ Millions)
Figure 80. GCC Country Stone Plastic Floor Revenue Growth 2016-2021 ($ Millions)
Figure 81. Channels of Distribution
Figure 82. Distributors Profiles
【免責事項】
https://www.globalresearch.jp/disclaimer