1 Scope of the Report
1.1 Market Introduction
1.2 Years Considered
1.3 Research Objectives
1.4 Market Research Methodology
1.5 Research Process and Data Source
1.6 Economic Indicators
1.7 Currency Considered
2 Executive Summary
2.1 World Market Overview
2.1.1 Global Hair Loss Products Consumption 2016-2026
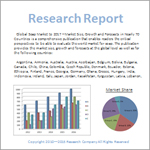
2.1.2 Hair Loss Products Consumption CAGR by Region
2.2 Hair Loss Products Segment by Type
2.2.1 Hair Loss and Growth Devices
2.2.2 Shampoos and Conditioners
2.2.3 Medicine Product
2.2.4 Others
2.3 Hair Loss Products Sales by Type
2.3.1 Global Hair Loss Products Sales Market Share by Type (2016-2021)
2.3.2 Global Hair Loss Products Revenue and Market Share by Type (2016-2021)
2.3.3 Global Hair Loss Products Sale Price by Type (2016-2021)
2.4 Hair Loss Products Segment by Application
2.4.1 Men
2.4.2 Women
2.5 Hair Loss Products Sales by Application
2.5.1 Global Hair Loss Products Sale Market Share by Application (2016-2021)
2.5.2 Global Hair Loss Products Revenue and Market Share by Application (2016-2021)
2.5.3 Global Hair Loss Products Sale Price by Application (2016-2021)
3 Global Hair Loss Products by Company
3.1 Global Hair Loss Products Sales Market Share by Company
3.1.1 Global Hair Loss Products Sales by Company (2019-2021)
3.1.2 Global Hair Loss Products Sales Market Share by Company (2019-2021)
3.2 Global Hair Loss Products Revenue Market Share by Company
3.2.1 Global Hair Loss Products Revenue by Company (2019-2021)
3.2.2 Global Hair Loss Products Revenue Market Share by Company (2019-2021)
3.3 Global Hair Loss Products Sale Price by Company
3.4 Global Manufacturers Hair Loss Products Producing Area Distribution, Sales Area, Product Type
3.4.1 Key Manufacturers Hair Loss Products Product Location Distribution
3.4.2 Players Hair Loss Products Products Offered
3.5 Market Concentration Rate Analysis
3.5.1 Competition Landscape Analysis
3.5.2 Concentration Ratio (CR3, CR5 and CR10) & (2019-2021)
3.6 New Products and Potential Entrants
3.7 Mergers & Acquisitions, Expansion
4 Hair Loss Products by Region
4.1 Global Hair Loss Products by Region
4.1.1 Global Hair Loss Products Sales by Region
4.1.2 Global Hair Loss Products Revenue by Region
4.2 Americas Hair Loss Products Sales Growth
4.3 APAC Hair Loss Products Sales Growth
4.4 Europe Hair Loss Products Sales Growth
4.5 Middle East & Africa Hair Loss Products Sales Growth
5 Americas
5.1 Americas Hair Loss Products Sales by Country
5.1.1 Americas Hair Loss Products Sales by Country (2016-2021)
5.1.2 Americas Hair Loss Products Revenue by Country (2016-2021)
5.2 Americas Hair Loss Products Sales by Type
5.3 Americas Hair Loss Products Sales by Application
5.4 United States
5.5 Canada
5.6 Mexico
5.7 Brazil
6 APAC
6.1 APAC Hair Loss Products Sales by Region
6.1.1 APAC Hair Loss Products Sales by Region (2016-2021)
6.1.2 APAC Hair Loss Products Revenue by Region (2016-2021)
6.2 APAC Hair Loss Products Sales by Type
6.3 APAC Hair Loss Products Sales by Application
6.4 China
6.5 Japan
6.6 Korea
6.7 Southeast Asia
6.8 India
6.9 Australia
7 Europe
7.1 Europe Hair Loss Products by Country
7.1.1 Europe Hair Loss Products Sales by Country (2016-2021)
7.1.2 Europe Hair Loss Products Revenue by Country (2016-2021)
7.2 Europe Hair Loss Products Sales by Type
7.3 Europe Hair Loss Products Sales by Application
7.4 Germany
7.5 France
7.6 UK
7.7 Italy
7.8 Russia
8 Middle East & Africa
8.1 Middle East & Africa Hair Loss Products by Country
8.1.1 Middle East & Africa Hair Loss Products Sales by Country (2016-2021)
8.1.2 Middle East & Africa Hair Loss Products Revenue by Country (2016-2021)
8.2 Middle East & Africa Hair Loss Products Sales by Type
8.3 Middle East & Africa Hair Loss Products Sales by Application
8.4 Egypt
8.5 South Africa
8.6 Israel
8.7 Turkey
8.8 GCC Country
9 Market Drivers, Challenges and Trends
9.1 Market Drivers and Impact
9.1.1 Growing Demand from Key Regions
9.1.2 Growing Demand from Key Applications and Potential Industries
9.2 Market Challenges and Impact
9.3 Market Trends
10 Marketing, Distributors and Customer
10.1 Sales Channel
10.1.1 Direct Channels
10.1.2 Indirect Channels
10.2 Hair Loss Products Distributors
10.3 Hair Loss Products Customer
11 Global Hair Loss Products Market Forecast
11.1 Global Hair Loss Products Forecast by Region
11.1.1 Global Hair Loss Products Forecast by Regions (2021-2026)
11.2.2 Global Hair Loss Products Revenue Forecast by Regions (2021-2026)
11.2 Americas Forecast by Countries
11.3 APAC Forecast by Region
11.4 Europe Forecast by Countries
11.5 Middle East & Africa Forecast by Countries
11.6 Global Hair Loss Products Forecast by Type
11.7 Global Hair Loss Products Forecast by Application
12 Key Players Analysis
12.1 L’Oreal
12.1.1 L’Oreal L’Oreal Company Information
12.1.2 L’Oreal Hair Loss Products Product Offered
12.1.3 L’Oreal Hair Loss Products Sales, Revenue, Price and Gross Margin (2019-2021)
12.1.4 L’Oreal Main Business Overview
12.1.5 L’Oreal Latest Developments
12.2 Unilever
12.2.1 Unilever Company Information
12.2.2 Unilever Hair Loss Products Product Offered
12.2.3 Unilever Hair Loss Products Sales, Revenue, Price and Gross Margin (2019-2021)
12.2.4 Unilever Main Business Overview
12.2.5 Unilever Latest Developments
12.3 Taisho
12.3.1 Taisho Company Information
12.3.2 Taisho Hair Loss Products Product Offered
12.3.3 Taisho Hair Loss Products Sales, Revenue, Price and Gross Margin (2019-2021)
12.3.4 Taisho Main Business Overview
12.3.5 Taisho Latest Developments
12.4 Henkel
12.4.1 Henkel Company Information
12.4.2 Henkel Hair Loss Products Product Offered
12.4.3 Henkel Hair Loss Products Sales, Revenue, Price and Gross Margin (2019-2021)
12.4.4 Henkel Main Business Overview
12.4.5 Henkel Latest Developments
12.5 Merck
12.5.1 Merck Company Information
12.5.2 Merck Hair Loss Products Product Offered
12.5.3 Merck Hair Loss Products Sales, Revenue, Price and Gross Margin (2019-2021)
12.5.4 Merck Main Business Overview
12.5.5 Merck Latest Developments
12.6 Shiseido
12.6.1 Shiseido Company Information
12.6.2 Shiseido Hair Loss Products Product Offered
12.6.3 Shiseido Hair Loss Products Sales, Revenue, Price and Gross Margin (2019-2021)
12.6.4 Shiseido Main Business Overview
12.6.5 Shiseido Latest Developments
12.7 Johnson & Johnson Consumer Inc.
12.7.1 Johnson & Johnson Consumer Inc. Company Information
12.7.2 Johnson & Johnson Consumer Inc. Hair Loss Products Product Offered
12.7.3 Johnson & Johnson Consumer Inc. Hair Loss Products Sales, Revenue, Price and Gross Margin (2019-2021)
12.7.4 Johnson & Johnson Consumer Inc. Main Business Overview
12.7.5 Johnson & Johnson Consumer Inc. Latest Developments
12.8 Rohto
12.8.1 Rohto Company Information
12.8.2 Rohto Hair Loss Products Product Offered
12.8.3 Rohto Hair Loss Products Sales, Revenue, Price and Gross Margin (2019-2021)
12.8.4 Rohto Main Business Overview
12.8.5 Rohto Latest Developments
12.9 Lifes2Good
12.9.1 Lifes2Good Company Information
12.9.2 Lifes2Good Hair Loss Products Product Offered
12.9.3 Lifes2Good Hair Loss Products Sales, Revenue, Price and Gross Margin (2019-2021)
12.9.4 Lifes2Good Main Business Overview
12.9.5 Lifes2Good Latest Developments
12.10 Gerolymatos International
12.10.1 Gerolymatos International Company Information
12.10.2 Gerolymatos International Hair Loss Products Product Offered
12.10.3 Gerolymatos International Hair Loss Products Sales, Revenue, Price and Gross Margin (2019-2021)
12.10.4 Gerolymatos International Main Business Overview
12.10.5 Gerolymatos International Latest Developments
12.11 Toppik
12.11.1 Toppik Company Information
12.11.2 Toppik Hair Loss Products Product Offered
12.11.3 Toppik Hair Loss Products Sales, Revenue, Price and Gross Margin (2019-2021)
12.11.4 Toppik Main Business Overview
12.11.5 Toppik Latest Developments
12.12 Nanogen
12.12.1 Nanogen Company Information
12.12.2 Nanogen Hair Loss Products Product Offered
12.12.3 Nanogen Hair Loss Products Sales, Revenue, Price and Gross Margin (2019-2021)
12.12.4 Nanogen Main Business Overview
12.12.5 Nanogen Latest Developments
12.13 Oxford BioLabs Ltd.
12.13.1 Oxford BioLabs Ltd. Company Information
12.13.2 Oxford BioLabs Ltd. Hair Loss Products Product Offered
12.13.3 Oxford BioLabs Ltd. Hair Loss Products Sales, Revenue, Price and Gross Margin (2019-2021)
12.13.4 Oxford BioLabs Ltd. Main Business Overview
12.13.5 Oxford BioLabs Ltd. Latest Developments
12.14 Ultrax Labs
12.14.1 Ultrax Labs Company Information
12.14.2 Ultrax Labs Hair Loss Products Product Offered
12.14.3 Ultrax Labs Hair Loss Products Sales, Revenue, Price and Gross Margin (2019-2021)
12.14.4 Ultrax Labs Main Business Overview
12.14.5 Ultrax Labs Latest Developments
12.15 Avalon Natural Products
12.15.1 Avalon Natural Products Company Information
12.15.2 Avalon Natural Products Hair Loss Products Product Offered
12.15.3 Avalon Natural Products Hair Loss Products Sales, Revenue, Price and Gross Margin (2019-2021)
12.15.4 Avalon Natural Products Main Business Overview
12.15.5 Avalon Natural Products Latest Developments
12.16 Bayer
12.16.1 Bayer Company Information
12.16.2 Bayer Hair Loss Products Product Offered
12.16.3 Bayer Hair Loss Products Sales, Revenue, Price and Gross Margin (2019-2021)
12.16.4 Bayer Main Business Overview
12.16.5 Bayer Latest Developments
12.17 Pharma Medico
12.17.1 Pharma Medico Company Information
12.17.2 Pharma Medico Hair Loss Products Product Offered
12.17.3 Pharma Medico Hair Loss Products Sales, Revenue, Price and Gross Margin (2019-2021)
12.17.4 Pharma Medico Main Business Overview
12.17.5 Pharma Medico Latest Developments
12.18 Kirkland Signature
12.18.1 Kirkland Signature Company Information
12.18.2 Kirkland Signature Hair Loss Products Product Offered
12.18.3 Kirkland Signature Hair Loss Products Sales, Revenue, Price and Gross Margin (2019-2021)
12.18.4 Kirkland Signature Main Business Overview
12.18.5 Kirkland Signature Latest Developments
12.19 Phyto Ales Group
12.19.1 Phyto Ales Group Company Information
12.19.2 Phyto Ales Group Hair Loss Products Product Offered
12.19.3 Phyto Ales Group Hair Loss Products Sales, Revenue, Price and Gross Margin (2019-2021)
12.19.4 Phyto Ales Group Main Business Overview
12.19.5 Phyto Ales Group Latest Developments
12.20 Amplixin
12.20.1 Amplixin Company Information
12.20.2 Amplixin Hair Loss Products Product Offered
12.20.3 Amplixin Hair Loss Products Sales, Revenue, Price and Gross Margin (2019-2021)
12.20.4 Amplixin Main Business Overview
12.20.5 Amplixin Latest Developments
12.21 Kerafiber
12.21.1 Kerafiber Company Information
12.21.2 Kerafiber Hair Loss Products Product Offered
12.21.3 Kerafiber Hair Loss Products Sales, Revenue, Price and Gross Margin (2019-2021)
12.21.4 Kerafiber Main Business Overview
12.21.5 Kerafiber Latest Developments
12.22 Phyto
12.22.1 Phyto Company Information
12.22.2 Phyto Hair Loss Products Product Offered
12.22.3 Phyto Hair Loss Products Sales, Revenue, Price and Gross Margin (2019-2021)
12.22.4 Phyto Main Business Overview
12.22.5 Phyto Latest Developments
12.23 Keranique
12.23.1 Keranique Company Information
12.23.2 Keranique Hair Loss Products Product Offered
12.23.3 Keranique Hair Loss Products Sales, Revenue, Price and Gross Margin (2019-2021)
12.23.4 Keranique Main Business Overview
12.23.5 Keranique Latest Developments
12.24 DS Healthcare Group
12.24.1 DS Healthcare Group Company Information
12.24.2 DS Healthcare Group Hair Loss Products Product Offered
12.24.3 DS Healthcare Group Hair Loss Products Sales, Revenue, Price and Gross Margin (2019-2021)
12.24.4 DS Healthcare Group Main Business Overview
12.24.5 DS Healthcare Group Latest Developments
12.25 Kaminomoto
12.25.1 Kaminomoto Company Information
12.25.2 Kaminomoto Hair Loss Products Product Offered
12.25.3 Kaminomoto Hair Loss Products Sales, Revenue, Price and Gross Margin (2019-2021)
12.25.4 Kaminomoto Main Business Overview
12.25.5 Kaminomoto Latest Developments
12.26 Softto
12.26.1 Softto Company Information
12.26.2 Softto Hair Loss Products Product Offered
12.26.3 Softto Hair Loss Products Sales, Revenue, Price and Gross Margin (2019-2021)
12.26.4 Softto Main Business Overview
12.26.5 Softto Latest Developments
12.27 Bawang
12.27.1 Bawang Company Information
12.27.2 Bawang Hair Loss Products Product Offered
12.27.3 Bawang Hair Loss Products Sales, Revenue, Price and Gross Margin (2019-2021)
12.27.4 Bawang Main Business Overview
12.27.5 Bawang Latest Developments
12.28 Zhang Guang 101
12.28.1 Zhang Guang 101 Company Information
12.28.2 Zhang Guang 101 Hair Loss Products Product Offered
12.28.3 Zhang Guang 101 Hair Loss Products Sales, Revenue, Price and Gross Margin (2019-2021)
12.28.4 Zhang Guang 101 Main Business Overview
12.28.5 Zhang Guang 101 Latest Developments
13 Research Findings and Conclusion
List of TablesTable 1. Hair Loss Products Consumption CAGR by Region (2020-2026) & ($ Millions)
Table 2. Major Players of Hair Loss and Growth Devices
Table 3. Major Players of Shampoos and Conditioners
Table 4. Major Players of Medicine Product
Table 5. Major Players of Others
Table 6. Global Hair Loss Products Sales by Type (2016-2021) & (K MT)
Table 7. Global Hair Loss Products Sales Market Share by Type (2016-2021)
Table 8. Global Hair Loss Products Revenue by Type (2016-2021) & ($ million)
Table 9. Global Hair Loss Products Revenue Market Share by Type (2016-2021)
Table 10. Global Hair Loss Products Sale Price by Type (2016-2021)
Table 11. Global Hair Loss Products Sales by Application (2016-2021) & (K MT)
Table 12. Global Hair Loss Products Sales Market Share by Application (2016-2021)
Table 13. Global Hair Loss Products Value by Application (2016-2021)
Table 14. Global Hair Loss Products Revenue Market Share by Application (2016-2021)
Table 15. Global Hair Loss Products Sale Price by Application (2016-2021)
Table 16. Global Hair Loss Products Sales by Company (2019-2021) & (K MT)
Table 17. Global Hair Loss Products Sales Market Share by Company (2019-2021)
Table 18. Global Hair Loss Products Revenue by Company (2019-2021) ($ Millions)
Table 19. Global Hair Loss Products Revenue Market Share by Company (2019-2021)
Table 20. Global Hair Loss Products Sale Price by Company (2019-2021)
Table 21. Key Manufacturers Hair Loss Products Producing Area Distribution and Sales Area
Table 22. Players Hair Loss Products Products Offered
Table 23. Hair Loss Products Concentration Ratio (CR3, CR5 and CR10) & (2019-2021)
Table 24. New Products and Potential Entrants
Table 25. Mergers & Acquisitions, Expansion
Table 26. Global Hair Loss Products Sales by Region (2016-2021) (K MT)
Table 27. Global Hair Loss Products Sales Market Share by Region (2016-2021)
Table 28. Global Hair Loss Products Revenue by Region (2016-2021) & ($ Millions)
Table 29. Global Hair Loss Products Revenue Market Share by Region (2016-2021)
Table 30. Americas Hair Loss Products Sales by Country (2016-2021) & (K MT)
Table 31. Americas Hair Loss Products Sales Market Share by Country (2016-2021)
Table 32. Americas Hair Loss Products Revenue by Country (2016-2021) & ($ Millions)
Table 33. Americas Hair Loss Products Revenue Market Share by Country (2016-2021)
Table 34. Americas Hair Loss Products Sales by Type (2016-2021) & (K MT)
Table 35. Americas Hair Loss Products Sales Market Share by Type (2016-2021)
Table 36. Americas Hair Loss Products Sales by Application (2016-2021) & (K MT)
Table 37. Americas Hair Loss Products Sales Market Share by Application (2016-2021)
Table 38. APAC Hair Loss Products Sales by Region (2016-2021) & (K MT)
Table 39. APAC Hair Loss Products Sales Market Share by Region (2016-2021)
Table 40. APAC Hair Loss Products Revenue by Region (2016-2021) & ($ Millions)
Table 41. APAC Hair Loss Products Revenue Market Share by Region (2016-2021)
Table 42. APAC Hair Loss Products Sales by Type (2016-2021) & (K MT)
Table 43. APAC Hair Loss Products Sales Market Share by Type (2016-2021)
Table 44. APAC Hair Loss Products Sales by Application (2016-2021) & (K MT)
Table 45. APAC Hair Loss Products Sales Market Share by Application (2016-2021)
Table 46. Europe Hair Loss Products Sales by Country (2016-2021) & (K MT)
Table 47. Europe Hair Loss Products Sales Market Share by Country (2016-2021)
Table 48. Europe Hair Loss Products Revenue by Country (2016-2021) & ($ Millions)
Table 49. Europe Hair Loss Products Revenue Market Share by Country (2016-2021)
Table 50. Europe Hair Loss Products Sales by Type (2016-2021) & (K MT)
Table 51. Europe Hair Loss Products Sales Market Share by Type (2016-2021)
Table 52. Europe Hair Loss Products Sales by Application (2016-2021) & (K MT)
Table 53. Europe Hair Loss Products Sales Market Share by Application (2016-2021)
Table 54. Middle East & Africa Hair Loss Products Sales by Country (2016-2021) & (K MT)
Table 55. Middle East & Africa Hair Loss Products Sales Market Share by Country (2016-2021)
Table 56. Middle East & Africa Hair Loss Products Revenue by Country (2016-2021) & ($ Millions)
Table 57. Middle East & Africa Hair Loss Products Revenue Market Share by Country (2016-2021)
Table 58. Middle East & Africa Hair Loss Products Sales by Type (2016-2021) & (K MT)
Table 59. Middle East & Africa Hair Loss Products Sales Market Share by Type (2016-2021)
Table 60. Middle East & Africa Hair Loss Products Sales by Application (2016-2021) & (K MT)
Table 61. Middle East & Africa Hair Loss Products Sales Market Share by Application (2016-2021)
Table 62. Global Hair Loss Products Sales Forecast by Type (2021-2026) & (K MT)
Table 63. Global Hair Loss Products Sales Market Share Forecast by Type (2021-2026)
Table 64. Global Hair Loss Products Revenue Forecast by Type (2021-2026) & ($ Millions)
Table 65. Global Hair Loss Products Revenue Market Share Forecast by Type (2021-2026)
Table 66. Global Hair Loss Products Sales Forecast by Application (2021-2026) & (K MT)
Table 67. Global Hair Loss Products Sales Market Share Forecast by Application (2021-2026)
Table 68. Global Hair Loss Products Revenue Forecast by Application (2021-2026) & ($ Millions)
Table 69. Global Hair Loss Products Revenue Market Share Forecast by Application (2021-2026)
Table 70. L’Oreal Basic Information, Hair Loss Products Manufacturing Base, Sales Area and Its Competitors
Table 71. L’Oreal Hair Loss Products Product Offered
Table 72. L’Oreal Hair Loss Products Sales (K MT), Revenue ($ Million), Price (USD/MT) and Gross Margin (2019-2021E)
Table 73. L’Oreal Main Business
Table 74. L’Oreal Latest Developments
Table 75. Unilever Basic Information, Hair Loss Products Manufacturing Base, Sales Area and Its Competitors
Table 76. Unilever Hair Loss Products Product Offered
Table 77. Unilever Hair Loss Products Sales (K MT), Revenue ($ Million), Price (USD/MT) and Gross Margin (2019-2021E)
Table 78. Unilever Main Business
Table 79. Unilever Latest Developments
Table 80. Taisho Basic Information, Hair Loss Products Manufacturing Base, Sales Area and Its Competitors
Table 81. Taisho Hair Loss Products Product Offered
Table 82. Taisho Hair Loss Products Sales (K MT), Revenue ($ Million), Price (USD/MT) and Gross Margin (2019-2021E)
Table 83. Taisho Main Business
Table 84. Taisho Latest Developments
Table 85. Henkel Basic Information, Hair Loss Products Manufacturing Base, Sales Area and Its Competitors
Table 86. Henkel Hair Loss Products Product Offered
Table 87. Henkel Hair Loss Products Sales (K MT), Revenue ($ Million), Price (USD/MT) and Gross Margin (2019-2021E)
Table 88. Henkel Main Business
Table 89. Henkel Latest Developments
Table 90. Merck Basic Information, Hair Loss Products Manufacturing Base, Sales Area and Its Competitors
Table 91. Merck Hair Loss Products Product Offered
Table 92. Merck Hair Loss Products Sales (K MT), Revenue ($ Million), Price (USD/MT) and Gross Margin (2019-2021E)
Table 93. Merck Main Business
Table 94. Merck Latest Developments
Table 95. Shiseido Basic Information, Hair Loss Products Manufacturing Base, Sales Area and Its Competitors
Table 96. Shiseido Hair Loss Products Product Offered
Table 97. Shiseido Hair Loss Products Sales (K MT), Revenue ($ Million), Price (USD/MT) and Gross Margin (2019-2021E)
Table 98. Shiseido Main Business
Table 99. Shiseido Latest Developments
Table 100. Johnson & Johnson Consumer Inc. Basic Information, Hair Loss Products Manufacturing Base, Sales Area and Its Competitors
Table 101. Johnson & Johnson Consumer Inc. Hair Loss Products Product Offered
Table 102. Johnson & Johnson Consumer Inc. Hair Loss Products Sales (K MT), Revenue ($ Million), Price (USD/MT) and Gross Margin (2019-2021E)
Table 103. Johnson & Johnson Consumer Inc. Main Business
Table 104. Johnson & Johnson Consumer Inc. Latest Developments
Table 105. Rohto Basic Information, Hair Loss Products Manufacturing Base, Sales Area and Its Competitors
Table 106. Rohto Hair Loss Products Product Offered
Table 107. Rohto Hair Loss Products Sales (K MT), Revenue ($ Million), Price (USD/MT) and Gross Margin (2019-2021E)
Table 108. Rohto Main Business
Table 109. Rohto Latest Developments
Table 110. Lifes2Good Basic Information, Hair Loss Products Manufacturing Base, Sales Area and Its Competitors
Table 111. Lifes2Good Hair Loss Products Product Offered
Table 112. Lifes2Good Hair Loss Products Sales (K MT), Revenue ($ Million), Price (USD/MT) and Gross Margin (2019-2021E)
Table 113. Lifes2Good Main Business
Table 114. Lifes2Good Latest Developments
Table 115. Gerolymatos International Basic Information, Hair Loss Products Manufacturing Base, Sales Area and Its Competitors
Table 116. Gerolymatos International Hair Loss Products Product Offered
Table 117. Gerolymatos International Hair Loss Products Sales (K MT), Revenue ($ Million), Price (USD/MT) and Gross Margin (2019-2021E)
Table 118. Gerolymatos International Main Business
Table 119. Gerolymatos International Latest Developments
Table 120. Toppik Basic Information, Hair Loss Products Manufacturing Base, Sales Area and Its Competitors
Table 121. Toppik Hair Loss Products Product Offered
Table 122. Toppik Hair Loss Products Sales (K MT), Revenue ($ Million), Price (USD/MT) and Gross Margin (2019-2021E)
Table 123. Toppik Main Business
Table 124. Toppik Latest Developments
Table 125. Nanogen Basic Information, Hair Loss Products Manufacturing Base, Sales Area and Its Competitors
Table 126. Nanogen Hair Loss Products Product Offered
Table 127. Nanogen Hair Loss Products Sales (K MT), Revenue ($ Million), Price (USD/MT) and Gross Margin (2019-2021E)
Table 128. Nanogen Main Business
Table 129. Nanogen Latest Developments
Table 130. Oxford BioLabs Ltd. Basic Information, Hair Loss Products Manufacturing Base, Sales Area and Its Competitors
Table 131. Oxford BioLabs Ltd. Hair Loss Products Product Offered
Table 132. Oxford BioLabs Ltd. Hair Loss Products Sales (K MT), Revenue ($ Million), Price (USD/MT) and Gross Margin (2019-2021E)
Table 133. Oxford BioLabs Ltd. Main Business
Table 134. Oxford BioLabs Ltd. Latest Developments
Table 135. Ultrax Labs Basic Information, Hair Loss Products Manufacturing Base, Sales Area and Its Competitors
Table 136. Ultrax Labs Hair Loss Products Product Offered
Table 137. Ultrax Labs Hair Loss Products Sales (K MT), Revenue ($ Million), Price (USD/MT) and Gross Margin (2019-2021E)
Table 138. Ultrax Labs Main Business
Table 139. Ultrax Labs Latest Developments
Table 140. Avalon Natural Products Basic Information, Hair Loss Products Manufacturing Base, Sales Area and Its Competitors
Table 141. Avalon Natural Products Hair Loss Products Product Offered
Table 142. Avalon Natural Products Hair Loss Products Sales (K MT), Revenue ($ Million), Price (USD/MT) and Gross Margin (2019-2021E)
Table 143. Avalon Natural Products Main Business
Table 144. Avalon Natural Products Latest Developments
Table 145. Bayer Basic Information, Hair Loss Products Manufacturing Base, Sales Area and Its Competitors
Table 146. Bayer Hair Loss Products Product Offered
Table 147. Bayer Hair Loss Products Sales (K MT), Revenue ($ Million), Price (USD/MT) and Gross Margin (2019-2021E)
Table 148. Bayer Main Business
Table 149. Bayer Latest Developments
Table 150. Pharma Medico Basic Information, Hair Loss Products Manufacturing Base, Sales Area and Its Competitors
Table 151. Pharma Medico Hair Loss Products Product Offered
Table 152. Pharma Medico Hair Loss Products Sales (K MT), Revenue ($ Million), Price (USD/MT) and Gross Margin (2019-2021E)
Table 153. Pharma Medico Main Business
Table 154. Pharma Medico Latest Developments
Table 155. Kirkland Signature Basic Information, Hair Loss Products Manufacturing Base, Sales Area and Its Competitors
Table 156. Kirkland Signature Hair Loss Products Product Offered
Table 157. Kirkland Signature Hair Loss Products Sales (K MT), Revenue ($ Million), Price (USD/MT) and Gross Margin (2019-2021E)
Table 158. Kirkland Signature Main Business
Table 159. Kirkland Signature Latest Developments
Table 160. Phyto Ales Group Basic Information, Hair Loss Products Manufacturing Base, Sales Area and Its Competitors
Table 161. Phyto Ales Group Hair Loss Products Product Offered
Table 162. Phyto Ales Group Hair Loss Products Sales (K MT), Revenue ($ Million), Price (USD/MT) and Gross Margin (2019-2021E)
Table 163. Phyto Ales Group Main Business
Table 164. Phyto Ales Group Latest Developments
Table 165. Amplixin Basic Information, Hair Loss Products Manufacturing Base, Sales Area and Its Competitors
Table 166. Amplixin Hair Loss Products Product Offered
Table 167. Amplixin Hair Loss Products Sales (K MT), Revenue ($ Million), Price (USD/MT) and Gross Margin (2019-2021E)
Table 168. Amplixin Main Business
Table 169. Amplixin Latest Developments
Table 170. Kerafiber Basic Information, Hair Loss Products Manufacturing Base, Sales Area and Its Competitors
Table 171. Kerafiber Hair Loss Products Product Offered
Table 172. Kerafiber Hair Loss Products Sales (K MT), Revenue ($ Million), Price (USD/MT) and Gross Margin (2019-2021E)
Table 173. Kerafiber Main Business
Table 174. Kerafiber Latest Developments
Table 175. Phyto Basic Information, Hair Loss Products Manufacturing Base, Sales Area and Its Competitors
Table 176. Phyto Hair Loss Products Product Offered
Table 177. Phyto Hair Loss Products Sales (K MT), Revenue ($ Million), Price (USD/MT) and Gross Margin (2019-2021E)
Table 178. Phyto Main Business
Table 179. Phyto Latest Developments
Table 180. Keranique Basic Information, Hair Loss Products Manufacturing Base, Sales Area and Its Competitors
Table 181. Keranique Hair Loss Products Product Offered
Table 182. Keranique Hair Loss Products Sales (K MT), Revenue ($ Million), Price (USD/MT) and Gross Margin (2019-2021E)
Table 183. Keranique Main Business
Table 184. Keranique Latest Developments
Table 185. DS Healthcare Group Basic Information, Hair Loss Products Manufacturing Base, Sales Area and Its Competitors
Table 186. DS Healthcare Group Hair Loss Products Product Offered
Table 187. DS Healthcare Group Hair Loss Products Sales (K MT), Revenue ($ Million), Price (USD/MT) and Gross Margin (2019-2021E)
Table 188. DS Healthcare Group Main Business
Table 189. DS Healthcare Group Latest Developments
Table 190. Kaminomoto Basic Information, Hair Loss Products Manufacturing Base, Sales Area and Its Competitors
Table 191. Kaminomoto Hair Loss Products Product Offered
Table 192. Kaminomoto Hair Loss Products Sales (K MT), Revenue ($ Million), Price (USD/MT) and Gross Margin (2019-2021E)
Table 193. Kaminomoto Main Business
Table 194. Kaminomoto Latest Developments
Table 195. Softto Basic Information, Hair Loss Products Manufacturing Base, Sales Area and Its Competitors
Table 196. Softto Hair Loss Products Product Offered
Table 197. Softto Hair Loss Products Sales (K MT), Revenue ($ Million), Price (USD/MT) and Gross Margin (2019-2021E)
Table 198. Softto Main Business
Table 199. Softto Latest Developments
Table 200. Bawang Basic Information, Hair Loss Products Manufacturing Base, Sales Area and Its Competitors
Table 201. Bawang Hair Loss Products Product Offered
Table 202. Bawang Hair Loss Products Sales (K MT), Revenue ($ Million), Price (USD/MT) and Gross Margin (2019-2021E)
Table 203. Bawang Main Business
Table 204. Bawang Latest Developments
Table 205. Zhang Guang 101 Basic Information, Hair Loss Products Manufacturing Base, Sales Area and Its Competitors
Table 206. Zhang Guang 101 Hair Loss Products Product Offered
Table 207. Zhang Guang 101 Hair Loss Products Sales (K MT), Revenue ($ Million), Price (USD/MT) and Gross Margin (2019-2021E)
Table 208. Zhang Guang 101 Main Business
Table 209. Zhang Guang 101 Latest Developments
List of Figures
Figure 1. Picture of Hair Loss Products
Figure 2. Hair Loss Products Report Years Considered
Figure 3. Research Objectives
Figure 4. Research Methodology
Figure 5. Research Process and Data Source
Figure 6. Global Hair Loss Products Sales Growth Rate 2016-2026 (K MT)
Figure 7. Global Hair Loss Products Revenue Growth Rate 2016-2026 ($ Millions)
Figure 8. Hair Loss Products Sales by Region (2021 & 2026) & ($ millions)
Figure 9. Product Picture of Hair Loss and Growth Devices
Figure 10. Product Picture of Shampoos and Conditioners
Figure 11. Product Picture of Medicine Product
Figure 12. Product Picture of Others
Figure 13. Global Hair Loss Products Sales Market Share by Type in 2020
Figure 14. Global Hair Loss Products Revenue Market Share by Type (2016-2021)
Figure 15. Hair Loss Products Consumed in Men
Figure 16. Global Hair Loss Products Market: Men (2016-2021) & (K MT)
Figure 17. Hair Loss Products Consumed in Women
Figure 18. Global Hair Loss Products Market: Women (2016-2021) & (K MT)
Figure 19. Global Hair Loss Products Sales Market Share by Application (2016-2021)
Figure 20. Global Hair Loss Products Revenue Market Share by Application in 2020
Figure 21. Global Hair Loss Products Revenue Market by Company in 2020 ($ Million)
Figure 22. Global Hair Loss Products Revenue Market Share by Company in 2020
Figure 23. Global Hair Loss Products Sales Market Share by Regions (2016-2021)
Figure 24. Global Hair Loss Products Revenue Market Share by Region in 2020
Figure 25. Americas Hair Loss Products Sales 2016-2021 (K MT)
Figure 26. Americas Hair Loss Products Revenue 2016-2021 ($ Millions)
Figure 27. APAC Hair Loss Products Sales 2016-2021 (K MT)
Figure 28. APAC Hair Loss Products Revenue 2016-2021 ($ Millions)
Figure 29. Europe Hair Loss Products Sales 2016-2021 (K MT)
Figure 30. Europe Hair Loss Products Revenue 2016-2021 ($ Millions)
Figure 31. Middle East & Africa Hair Loss Products Sales 2016-2021 (K MT)
Figure 32. Middle East & Africa Hair Loss Products Revenue 2016-2021 ($ Millions)
Figure 33. Americas Hair Loss Products Sales Market Share by Country in 2020
Figure 34. Americas Hair Loss Products Revenue Market Share by Country in 2020
Figure 35. Americas Hair Loss Products Sales Market Share by Type in 2020
Figure 36. Americas Hair Loss Products Sales Market Share by Application in 2020
Figure 37. United States Hair Loss Products Revenue Growth 2016-2021 ($ Millions)
Figure 38. Canada Hair Loss Products Revenue Growth 2016-2021 ($ Millions)
Figure 39. Mexico Hair Loss Products Revenue Growth 2016-2021 ($ Millions)
Figure 40. Brazil Hair Loss Products Revenue Growth 2016-2021 ($ Millions)
Figure 41. APAC Hair Loss Products Sales Market Share by Region in 2020
Figure 42. APAC Hair Loss Products Revenue Market Share by Regions in 2020
Figure 43. APAC Hair Loss Products Sales Market Share by Type in 2020
Figure 44. APAC Hair Loss Products Sales Market Share by Application in 2020
Figure 45. China Hair Loss Products Revenue Growth 2016-2021 ($ Millions)
Figure 46. Japan Hair Loss Products Revenue Growth 2016-2021 ($ Millions)
Figure 47. Korea Hair Loss Products Revenue Growth 2016-2021 ($ Millions)
Figure 48. Southeast Asia Hair Loss Products Revenue Growth 2016-2021 ($ Millions)
Figure 49. India Hair Loss Products Revenue Growth 2016-2021 ($ Millions)
Figure 50. Australia Hair Loss Products Revenue Growth 2016-2021 ($ Millions)
Figure 51. Europe Hair Loss Products Sales Market Share by Country in 2020
Figure 52. Europe Hair Loss Products Revenue Market Share by Country in 2020
Figure 53. Europe Hair Loss Products Sales Market Share by Type in 2020
Figure 54. Europe Hair Loss Products Sales Market Share by Application in 2020
Figure 55. Germany Hair Loss Products Revenue Growth 2016-2021 ($ Millions)
Figure 56. France Hair Loss Products Revenue Growth 2016-2021 ($ Millions)
Figure 57. UK Hair Loss Products Revenue Growth 2016-2021 ($ Millions)
Figure 58. Italy Hair Loss Products Revenue Growth 2016-2021 ($ Millions)
Figure 59. Russia Hair Loss Products Revenue Growth 2016-2021 ($ Millions)
Figure 60. Middle East & Africa Hair Loss Products Sales Market Share by Country in 2020
Figure 61. Middle East & Africa Hair Loss Products Revenue Market Share by Country in 2020
Figure 62. Middle East & Africa Hair Loss Products Sales Market Share by Type in 2020
Figure 63. Middle East & Africa Hair Loss Products Sales Market Share by Application in 2020
Figure 64. Egypt Hair Loss Products Revenue Growth 2016-2021 ($ Millions)
Figure 65. South Africa Hair Loss Products Revenue Growth 2016-2021 ($ Millions)
Figure 66. Israel Hair Loss Products Revenue Growth 2016-2021 ($ Millions)
Figure 67. Turkey Hair Loss Products Revenue Growth 2016-2021 ($ Millions)
Figure 68. GCC Country Hair Loss Products Revenue Growth 2016-2021 ($ Millions)
Figure 69. Channels of Distribution
Figure 70. Distributors Profiles
【免責事項】
https://www.globalresearch.jp/disclaimer